


Solutions
Evaluate PHM as an Integrated System Capability
The Idealism of PHM (Prognostics Health Management)
In recent years, military and aerospace programs have dedicated significant resources toward research in advanced predictive maintenance technologies. In particular, much of the research focused on prognostics—developing sensors and measurements that they hope will not only improve system readiness, but also reduce the costs of product sustainment. Designed to identify incipient failures at the lowest levels of the system architecture, prognostic sensors are typically the end result of extremely detailed, yet extremely localized, physics-of-failure (“PoF”) analyses.
Moreover, the actual parameters of each prognostic measurement emerge only after extensive laboratory testing. Because prognostic sensors are so costly to develop and assess, the usefulness of these efforts tends to be evaluated in terms of success or failure, rather than on its relative impact upon system readiness or sustainment decision-making.
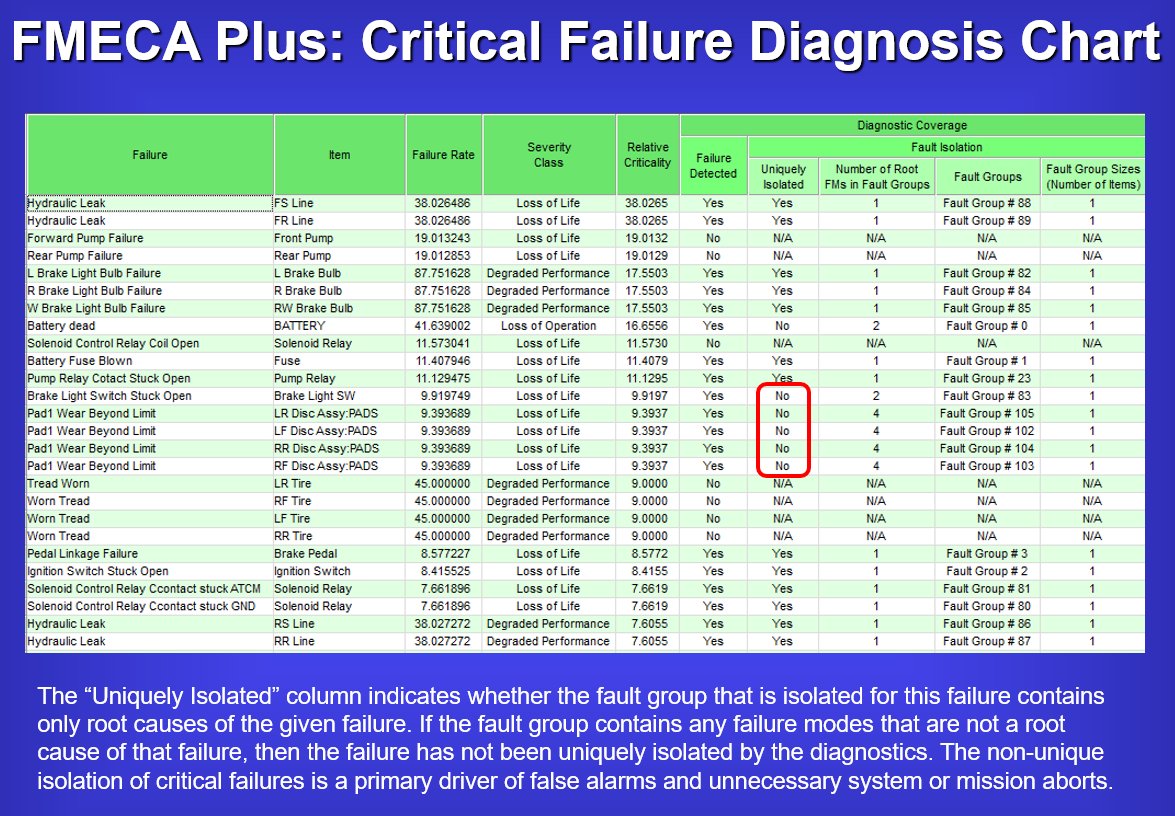
The above turn-key, “FMECA Plus Criticality Diagnosis Chart” integrates the Diagnostic Capability of the Design into the higher “System-Level Integrated FMECA”. In this manner, the constraints of the operational diagnostic capability (on-board BIT, etc.) determines utility of the sensors for PHM purposes at the Subsystem or System Levels.
Constraints of PHM can be Discovered by Examining the “FUI”
FUI is a term that is unique to the eXpress Diagnostics and overall ISDD paradigm, although it should be a term used ubiquitously within the diagnostic engineering community. It is a metric that describes a specific isolation precision so failures are not mischaracterized as a result of the constraints of the deployed diagnostic or PHM paradigm. When referring to “FUI”, it is meant to characterize the “testing” constraints of the BIT and/or as mixed with any form of Testing approaches.
“FUI” is an assessment metric to represent “Failures Uniquely Isolated”. In the context of the eXpress modeling paradigm, this is an invaluable bit of knowledge that can easily separate success from repeated failure in the Product Sustainment Lifecycle.
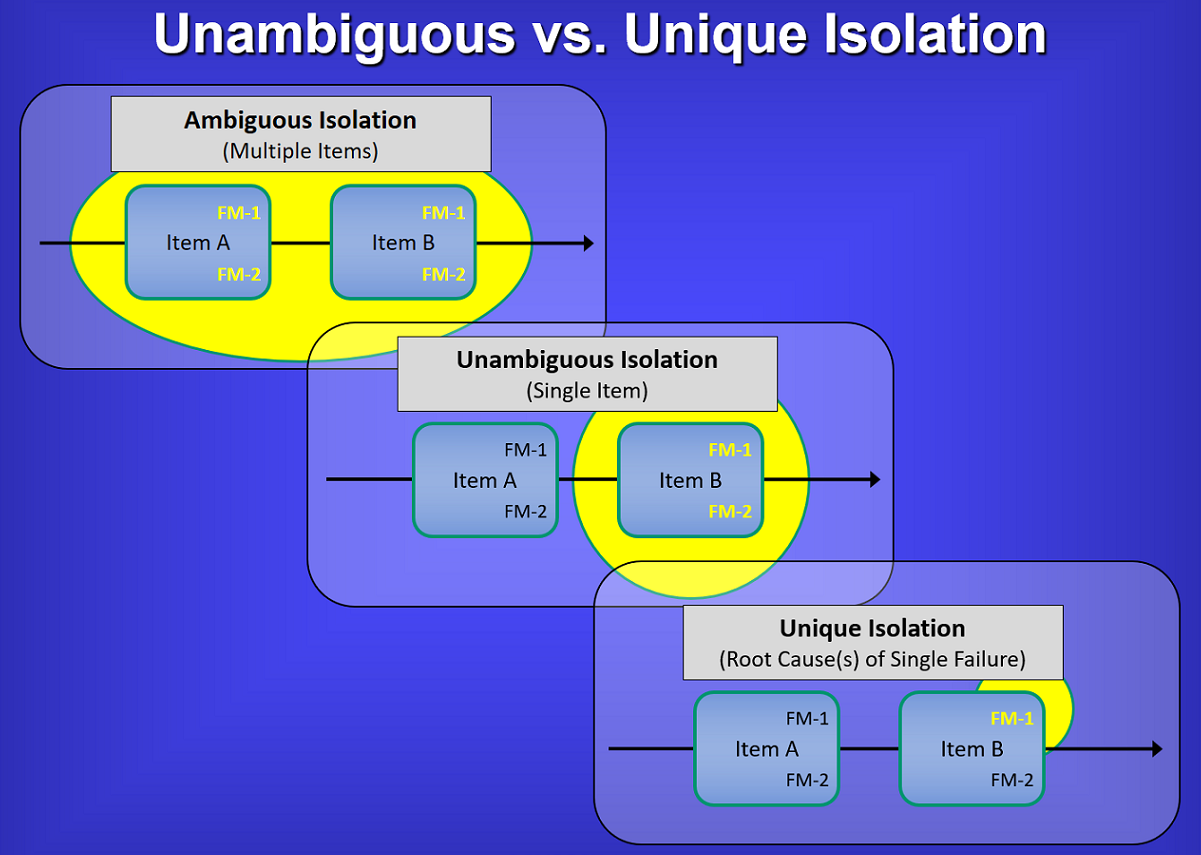
In referring to the image above, the top-left block depicts the failure detection & isolation (FD/FI) to be to a “Fault Group” of more that one (1) replaceable component. In Testability terminology, the example shows the detection and isolation to a Fault Group of two (2) components.
The “FM” characterizes the fact that the components have multiple failure modes. In the top and middle blocks, the constraints of the diagnostics capability does NOT allow for an ability to test “uniquely” for the failed function(s) between the Failure Mode(s) on any single component. But the middle block shows that the Testability Assessment product would indicate that the design is excellent by being capable to detect or isolate to the failure within a Fault Group containing one (1) component. Traditionally, this would be considered entirely acceptable from a “Design for Testability” perspective. But this is just is inadequate if truly concerned about designing for effective sustainment – regardless of technology or maintenance approach(e) (e.g. RCM, CBM and or any Predictive Maintenance technologies).
The lower block on the right side of the image (above) characterizes the ability to determine if the lower-level failure(s) are able to be “Uniquely Isolated” at the level of the executed test, which may, for example, be typically performed on-board with BIT in a Health Monitoring or Health Management paradigm. Too frequently, even the on-board ISHM, IVHM, or IHM systems still fail to consider this valuable insight when being designed. This can be ideal for dynamic safety mitigation corrective actions, but may also serve to be absolutely ineffective for transferring comprehensive diagnostic detail in seeding ensuing diagnostics and/or maintenance corrective/preventative actions.
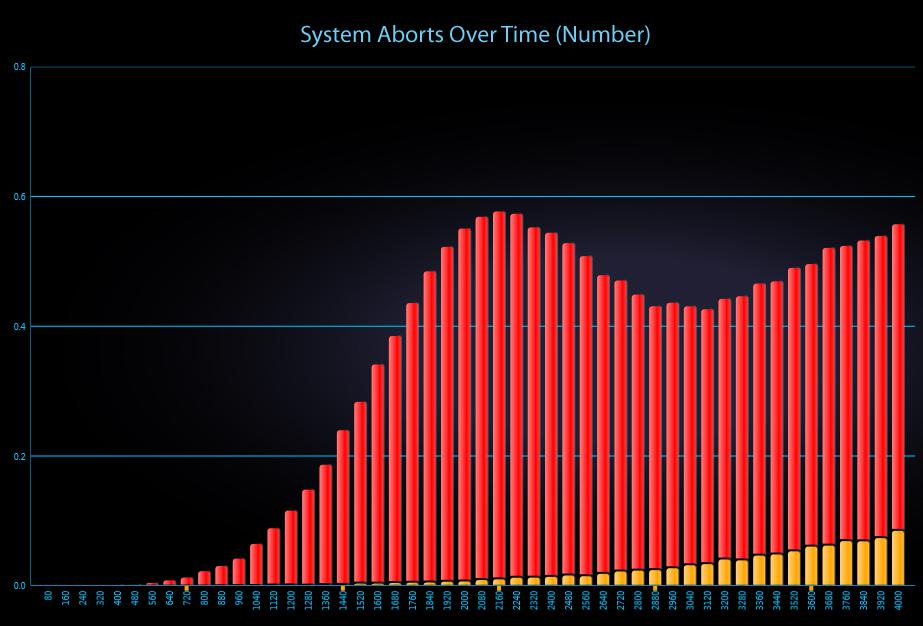
In such manner, FUI provides tremendous value in the immediate and significant reduction of “False System Aborts” versus “True System Aborts”, “True Alarms” versus “False Alarms” and preventing errors in determining improper corresponding corrective actions or autonomously-initiated remediation based upon non-vetted, “Integrated system(s)’ diagnostics that otherwise “assume” detected failures.
PHM Sensor Coverage target Lowest Levels of Design
As PHM activities are performed during design development, the sensors may also be designed to be uniquely specific to measure the low-level progression of an impending failure. These sensors are developed with expert care using algorithms unique to the assumed operational application. The objective of the sensors designed are to be able to observe and measure the progression of the impending failure on its “failure horizon” as reflected in the algorithms used for a specific physical component being “sensed” by the sensor(s). This progression across the component’s failure horizon is assumed to be a repeatable characteristic as based upon a series of Physics of Failure (PoF) studies have provided such supporting evidence.
But as the design matures, the Diagnostic model(s) can be used to provide full-up integrated system level assessments. There are many reports to discover where Prognostics makes sense and can add value within the context of the Operational asset (fielded “Integrated System”). As Prognostic Candidates are selected, it is equally important to assess their contribution as constrained within the diagnostic integrity of the full fielded system. The objective is to discover if the failure(s) are in fact, detected in any operational state of the fielded asset, given the test coverage of any sensor, or set of sensors, any interference interrelated therewith, and further dependent upon the validating the diagnostic status data being reported by the sensors. Validating the Diagnostic Integrity of any piece of the design at the System Level can make or break any investment poured into any IVHM, or PHM activity.
These sort of assessments can best be performed if able to transfer the entire captured expert knowledgebase into an Operational Support Simulation that can assess “Prognostic-Informed Diagnostics”, given the impact of Maintenance throughout the Sustainment lifecycle(s).
PHM Sensor Coverage and the Impact of Interference
While this appears repeatable in a laboratory environment, the jump to any uncontrolled operational environment provides a challenge to the predicting of the rate of failure progression on any given operational experience. Aside from this uncertainty, the PHM studies are not conclusive in the determining of any “interference” with the test coverage as caused from any other integrated subsystems nor any other designs contained within the system level design. Any subsystem or part of the design that may be impact the purity of BIT results, either before or after the Point of Test could certainly interfere with the lowest level precision of the data retrieved and reported by the lowest level sensors.
Although interference in the Test Coverage of the sensor isn’t uncommon for complex integrated systems, it is still not typically considered in lowest level PoF activities due to the nature of PoF studies entailing such a specialized and narrow scope of expertise. This is simply because expert designers in one domain or discipline are not equally involved to the same level of design detail in all other integrated subsystem designs within the complex or large-scale integrated system. Furthermore, Test Coverage corroboration and Test Coverage “gaps” in any specific operational mode, need to be assessed given the diagnostic and prognostic constraints determined by, and at, the system level analyses.
Without discovering these “gaps” during Design Development with a method that is fully capable of exploiting the operational effectiveness of the sensors from an integrated systems’ perspective – and learning what is NOT covered based upon diagnostic constraints – is just too easy to perform at a time when its affordable in every respect.
Maintenance Activities Reduce Continued Reliability of PHM
Additionally, the Maintenance philosophy/ies may “devalue” the investment into low-level PHM activities if not coordinated as a system-level sustainment requirement, which is typically not far outside the scope of any PHM design activities. As such, we need a much more mature methodology to capture all of this low-level expertise and not enable it to be diluted or inadvertently obfuscated when the system level design is fully integrated and then the fielded paradigm offers new replacement parts to then throw into the mix to further reduce the realized performance of our PHM capability.
Assessing any Investment into PHM via “Prognostics-Informed Diagnostics”
When Prognostics Health Management (PHM) is evaluated within the expert knowledgebase within DSI’s eXpress and ISDD, which is an environment that has captured the hierarchical interrelationships of the complex design, the essential prognostics “data points” are then able to be seamlessly integrated with the full system diagnostics.
As a result, the overall prognostic capability is assessed from a system perspective, giving us insight not only into the overall impact of prognostics, but also the relative value of individual prognostic measurements. Moreover, we can select whether or not prognostics should be taken into consideration when examining the diagnostic capability of the system. Whereas “prognostics-informed diagnostics” might give us a better sense of the expected behavior of the system in the field, the evaluation of diagnostics without prognostics allows us to account for the fact that the performance of fielded prognostics may sometimes differ from laboratory predictions.
So, before implementing prognostic solutions that have been proven to be “successful” under laboratory conditions, we should ask ourselves: “What will actually be gained through the implementation of this solution over alternative maintenance solutions?”, or “What impact will this solution have upon the overall system readiness, mission assurance and/or sustainment”? Else, “Will the gains reaped from prognostics be worth the cost of their development?”
Influencing the Design for any Health Management, including PHM
What is missing from most prognostic development efforts is the ability to determine, up front, the expected behavior of an overall health management solution (including the combined performance of corrective, condition-based and reliability-centered maintenance). The expected benefits of proposed prognostic sensors and measurements must be evaluated as part of a total maintenance “package”, and compared not with one-dimensional maintenance “straw men”, but rather with other viable, multi-faceted maintenance solutions. Also, any maintenance solutions must include a robust diagnostic design as a basis which is fully integrated with the prognostic health management solution. Moreover, these evaluations had best be performed relatively early in the development life-cycle—well before project resources have been committed to lengthy (and costly) physics-of-failure studies.
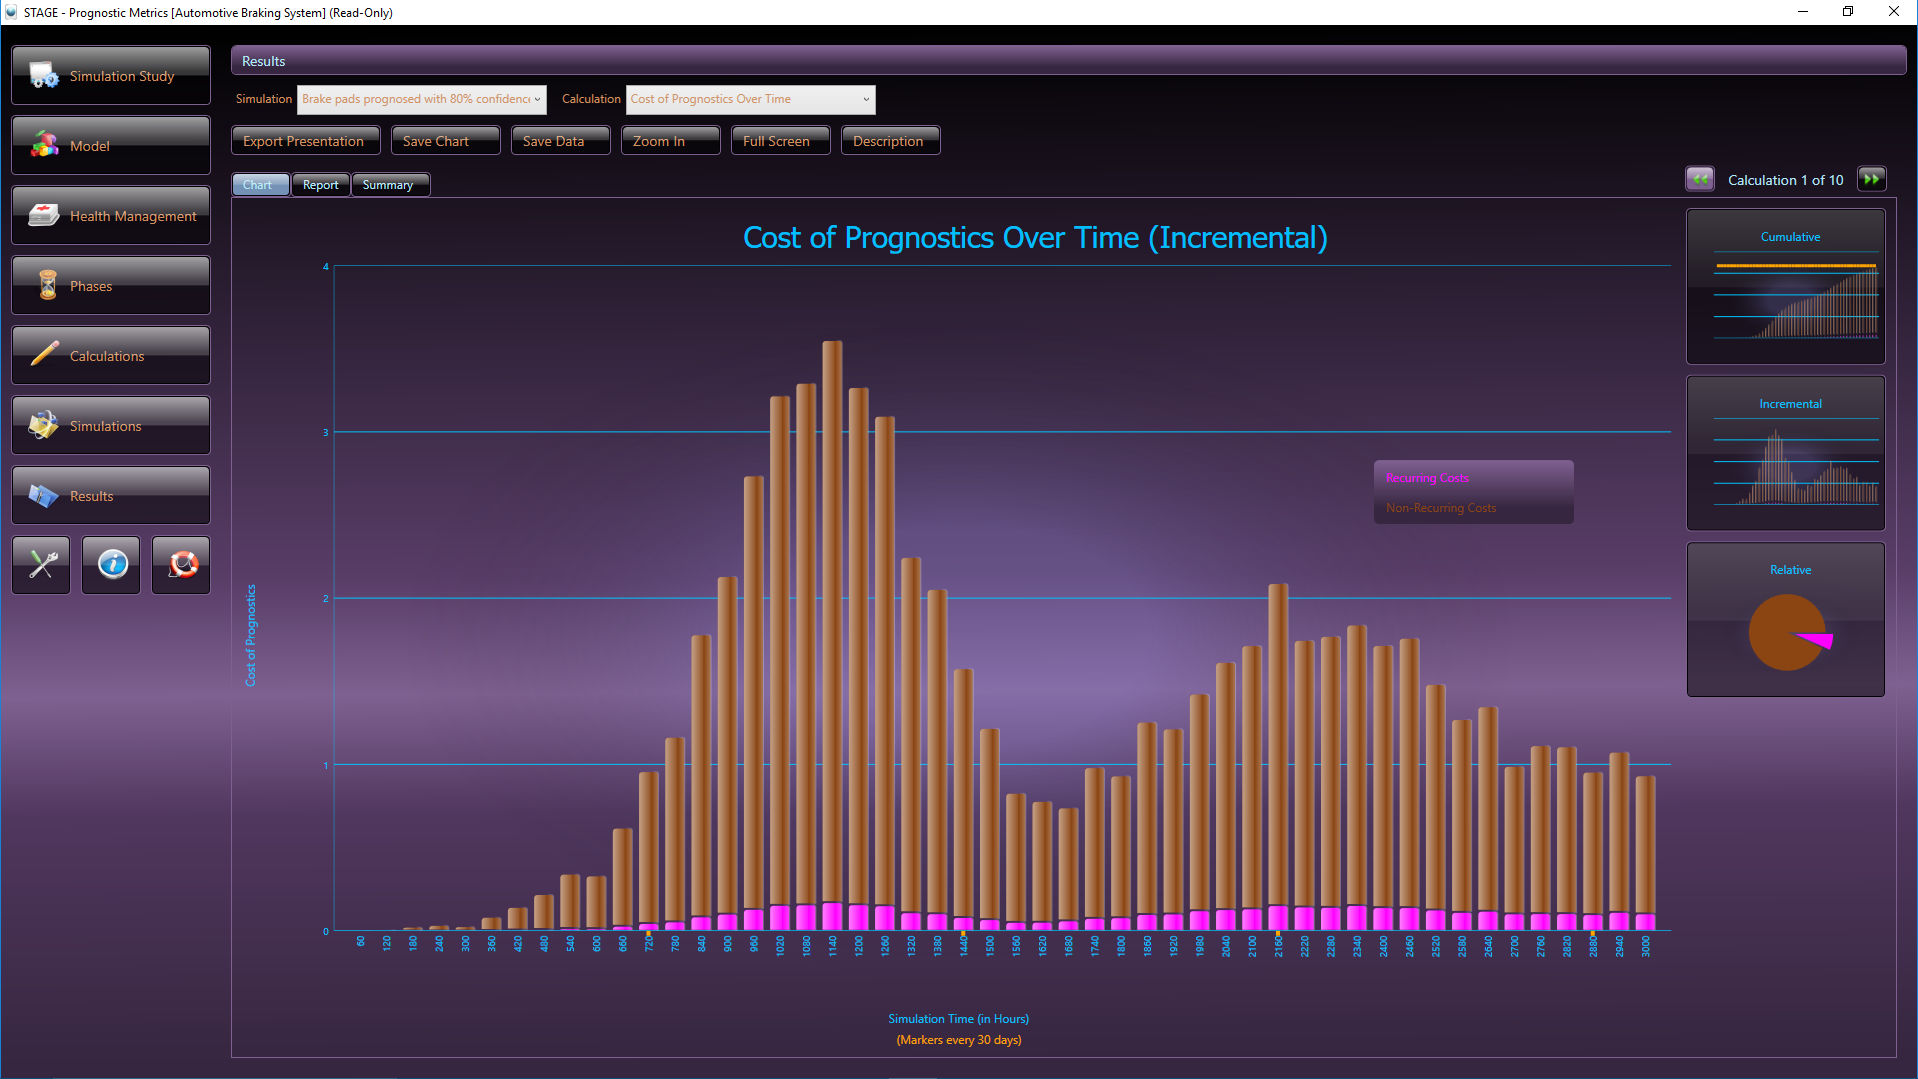
The chart below shows how an integrated thought-out approach for prognostic health management can provide significant benefits throughout the life cycle. Strategic investment early in the design & development phase of the life cycle along with the proper mindset, will yield significant savings and customer satisfaction; the opposite is also true.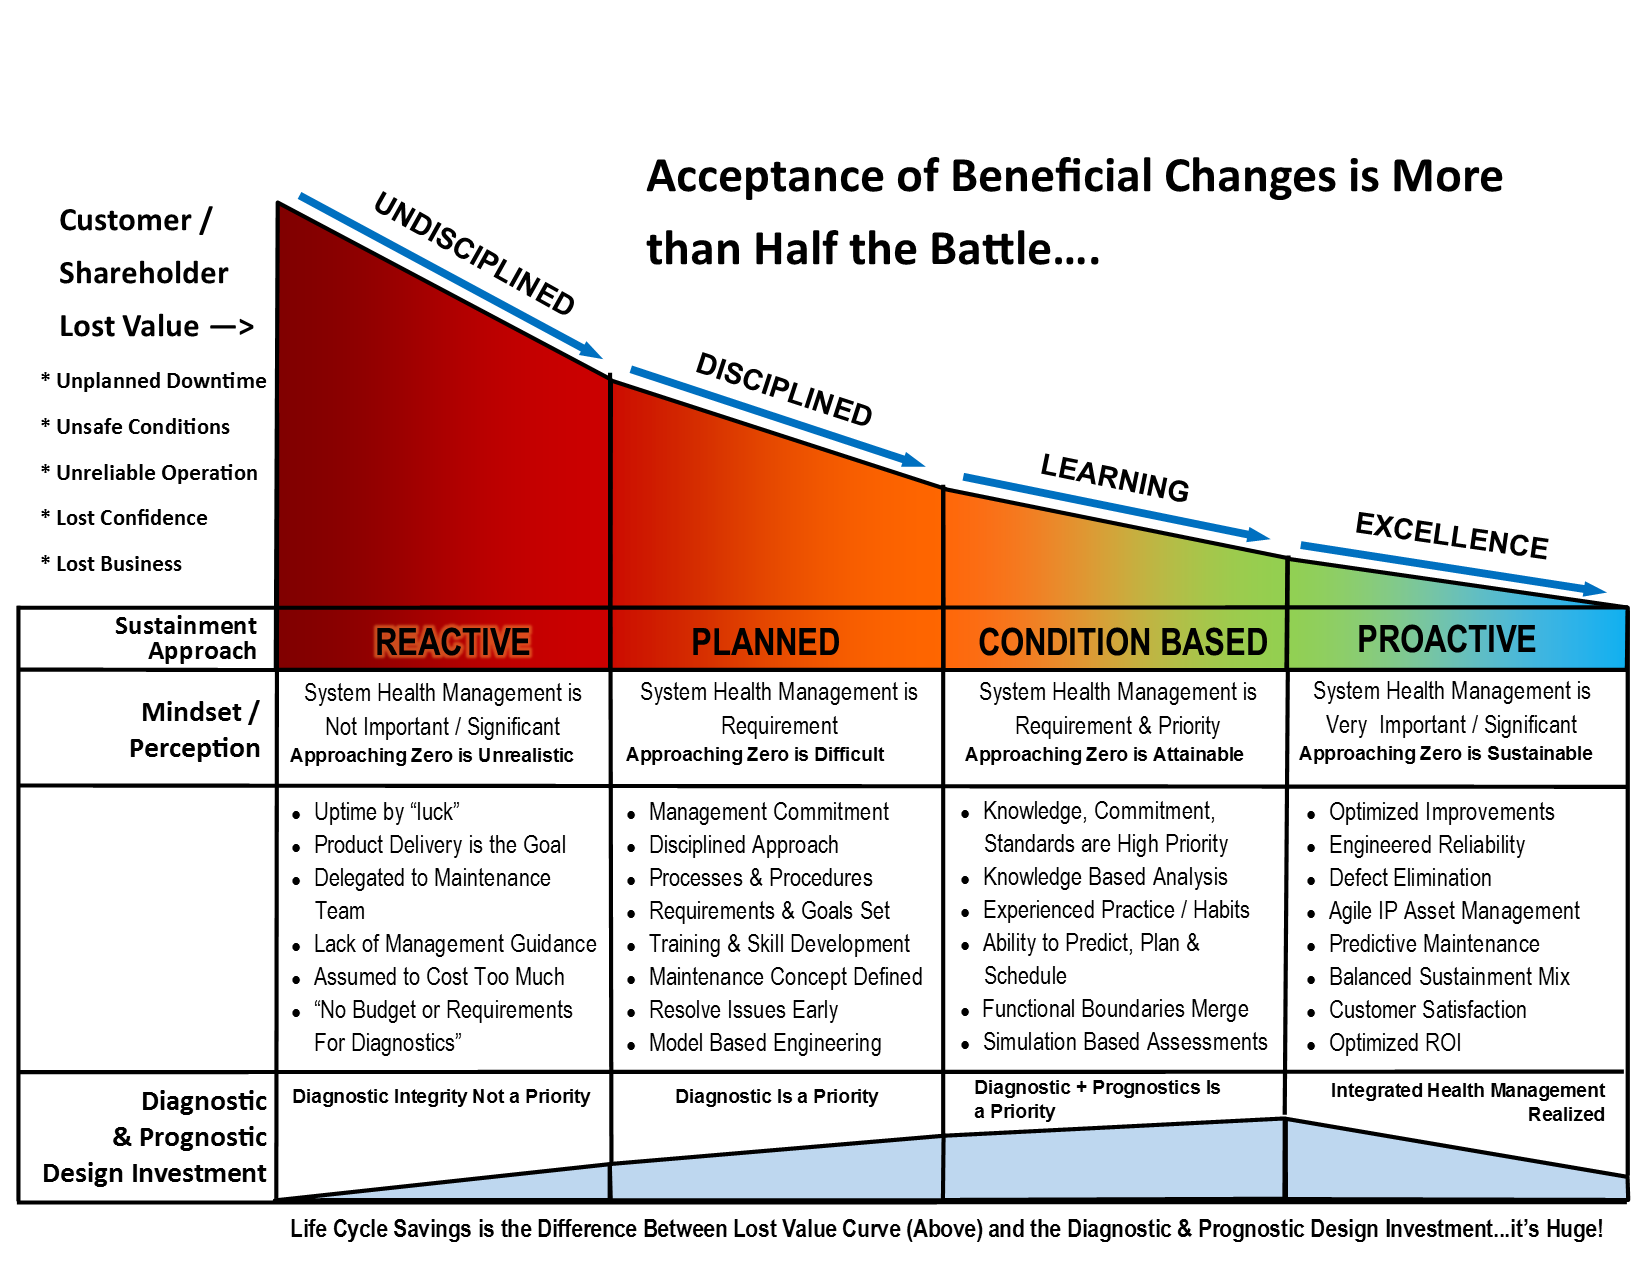
With any complex or critical Integrated System (meaning, “fielded product” or capability) where PHM is a consideration, it is implied that a low-level precision-based Failure Prediction technology would target an integral piece of a larger sustainment paradigm.
But, in the discovering of the added value of the implementation of the PHM piece (with like precision of the PHM technology itself) we need to procure a manicured assessment starting reference point. As such, the quantifying of any measurable sustainment benefit projected as reported in any system’s level assessment, must first be performed after the establishing of the Diagnostic Integrity “baseline” within the context and constraints of the design of fully fielded Integrated System(s) and while considering its (evolving) maintenance philosophy.
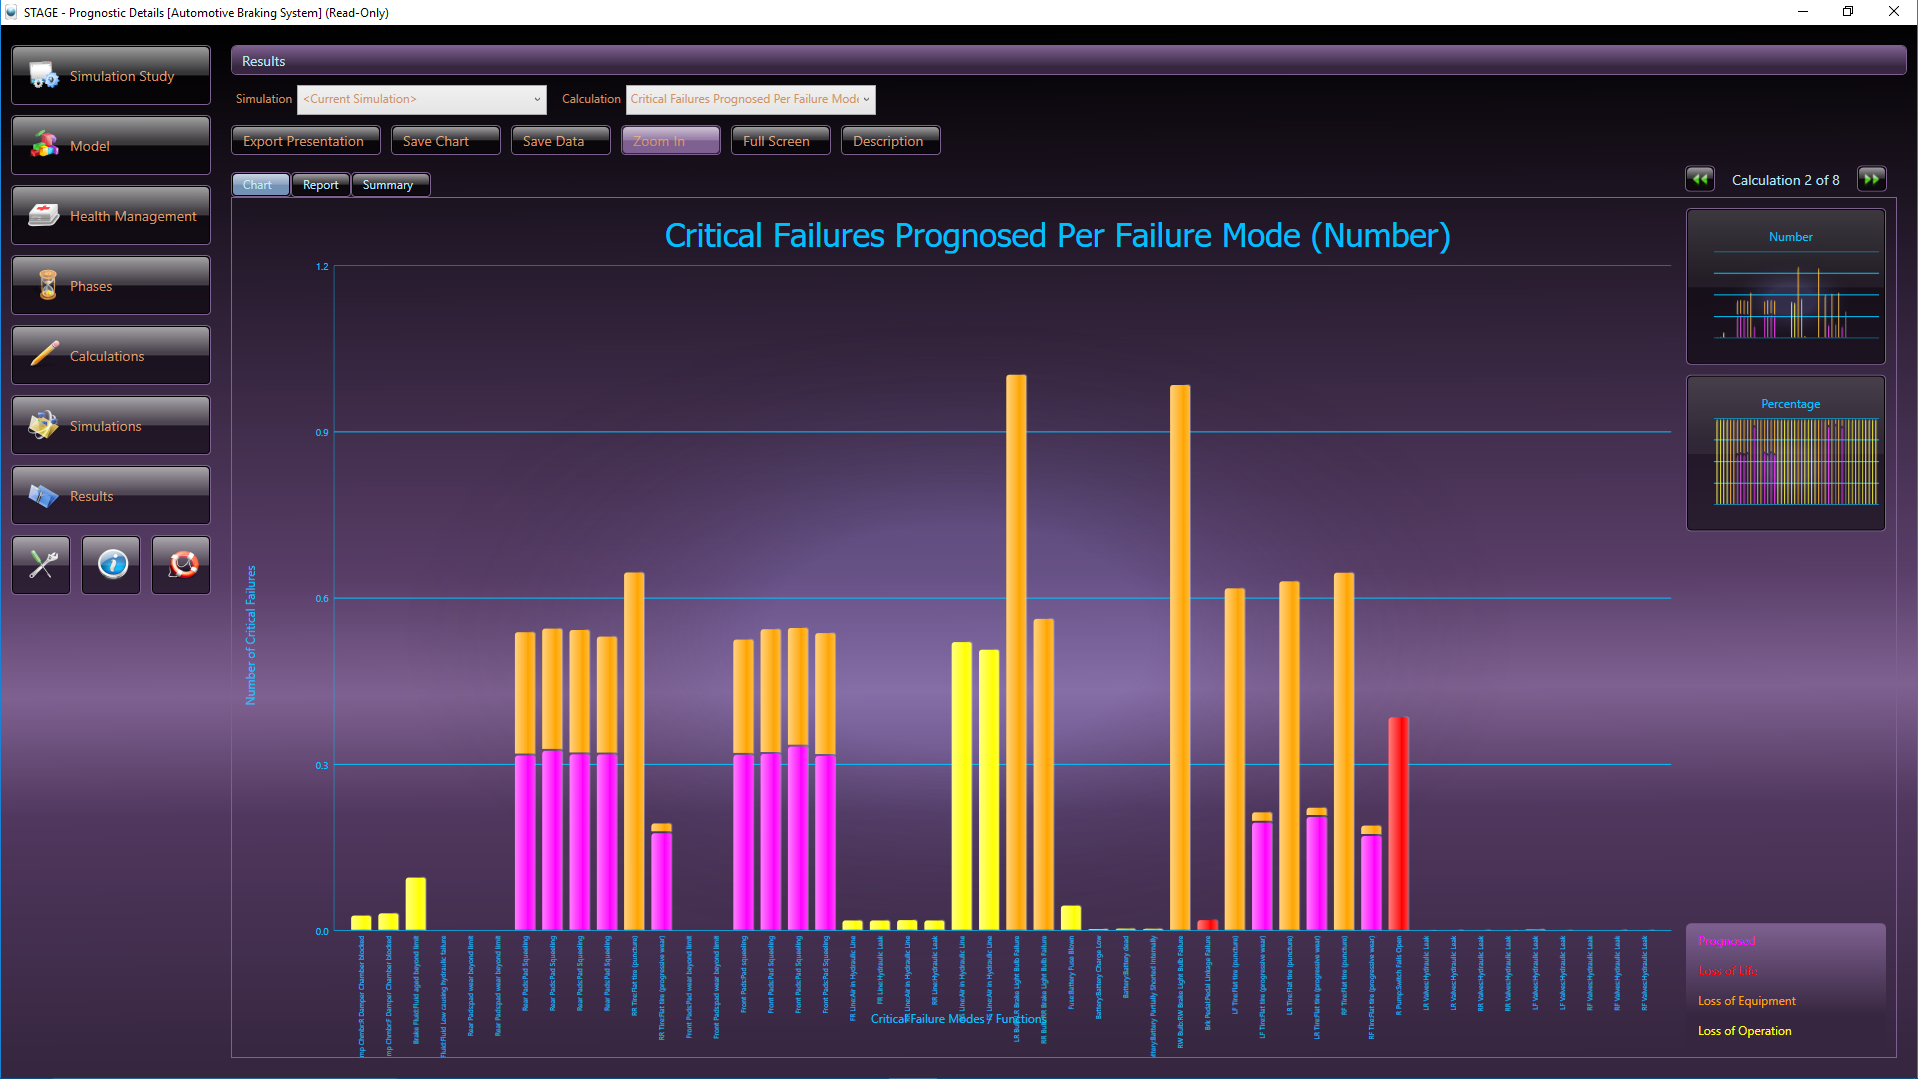
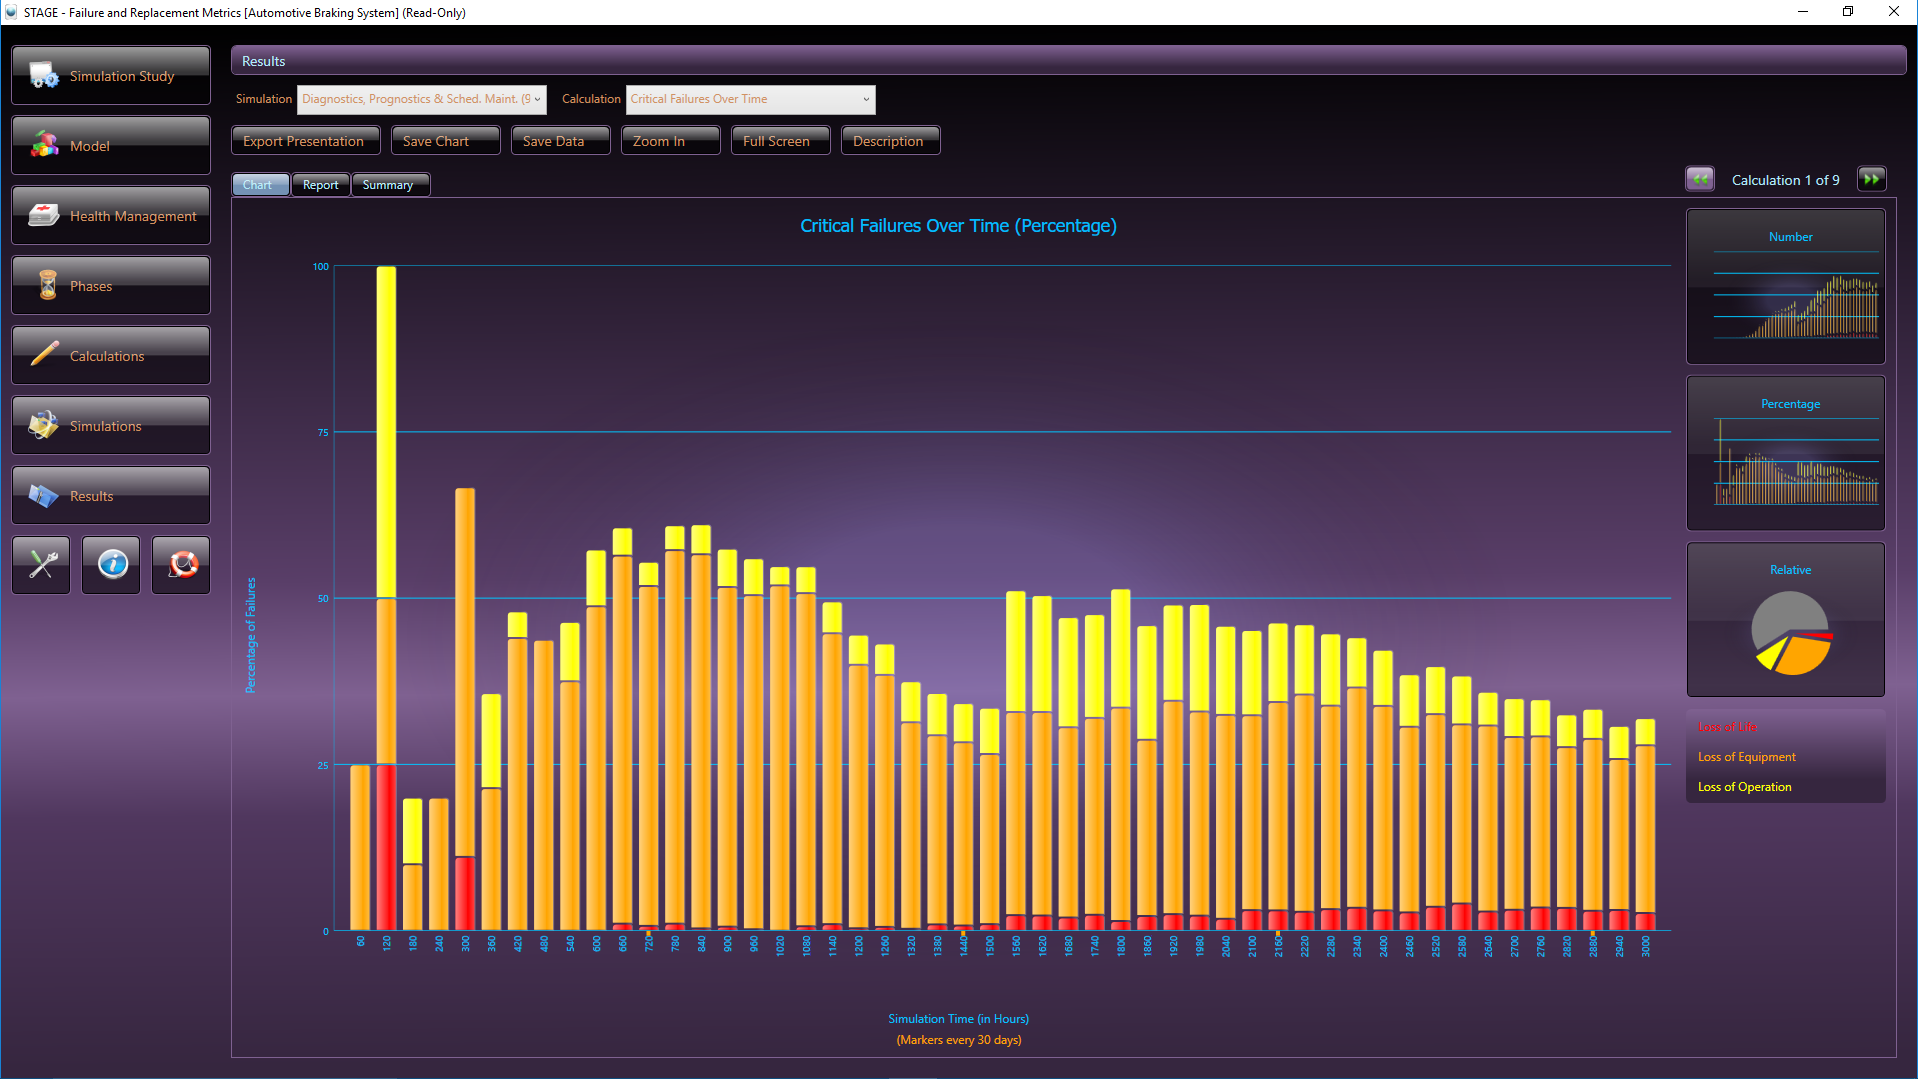
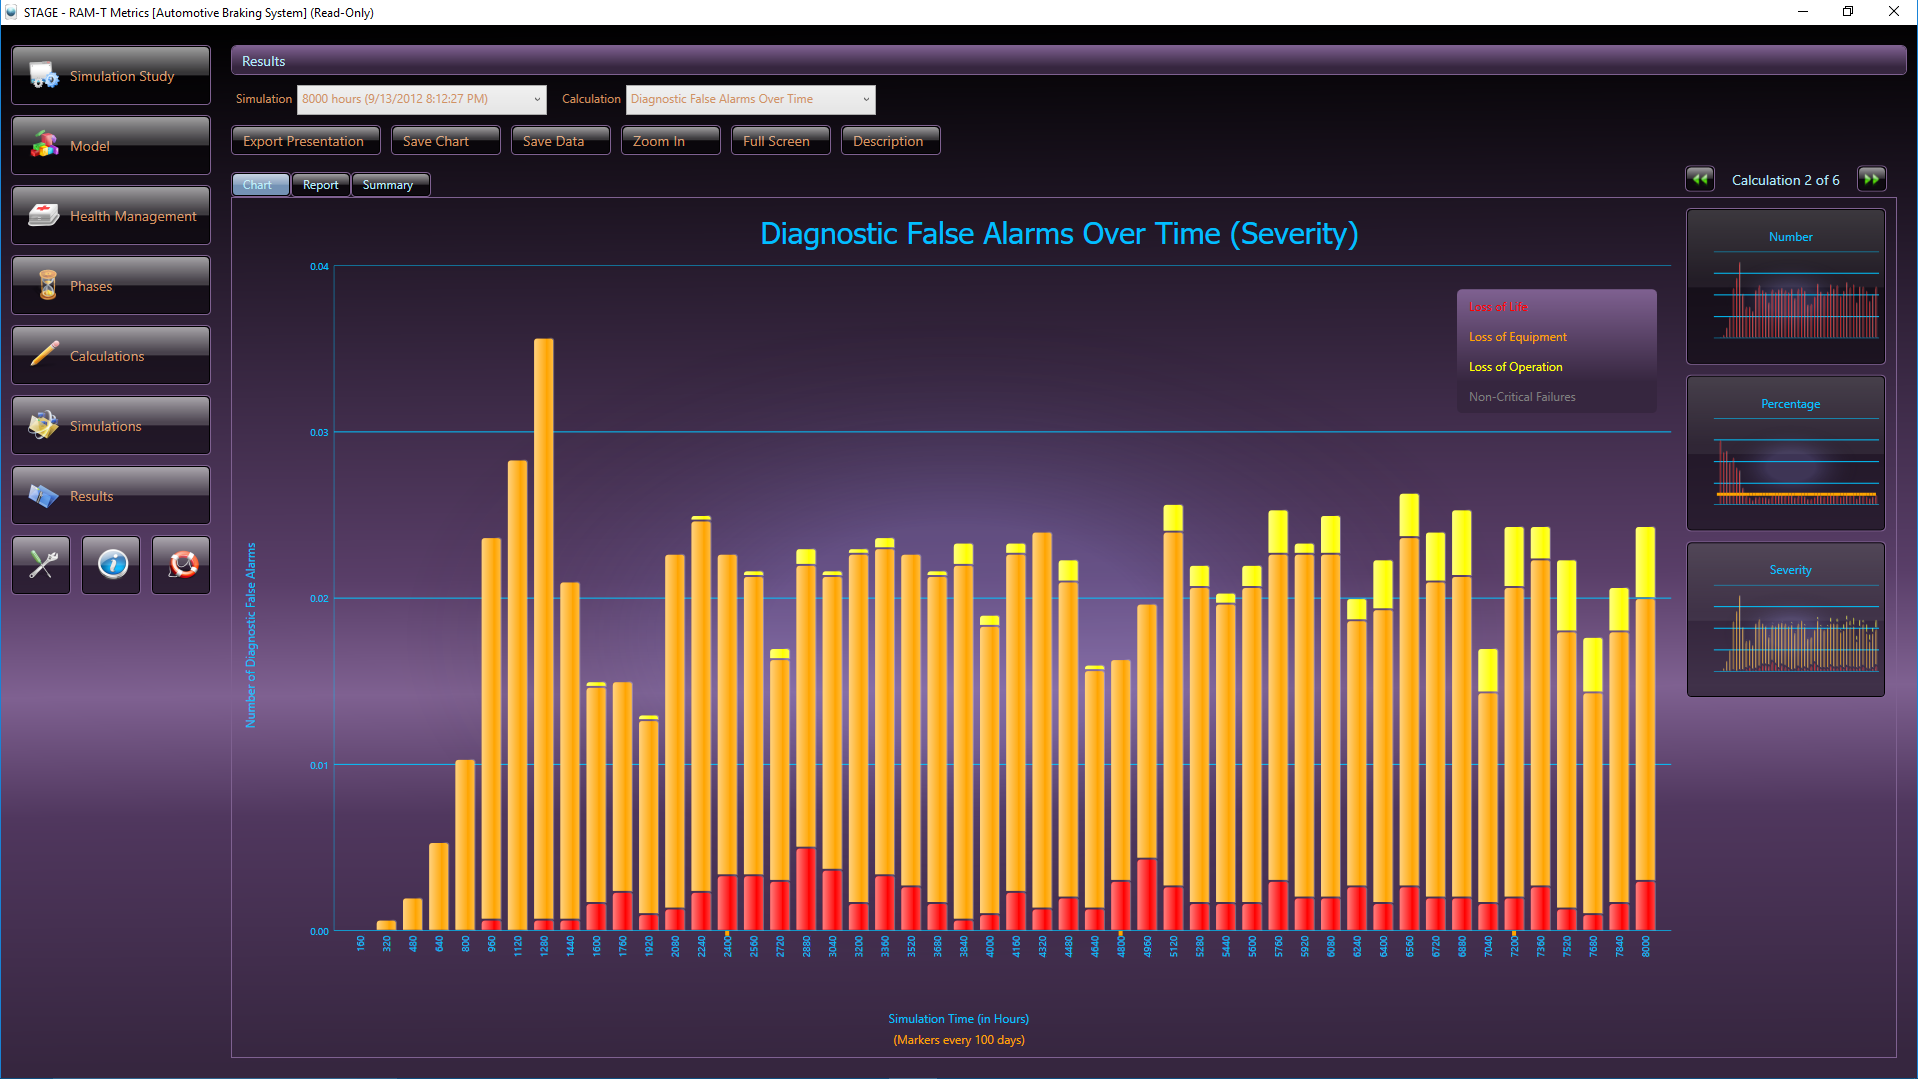
STAGE, DSI’s advanced Operational Support and Health Management simulation analysis tool, contains over 100 stock analyses algorithms for producing a wide variety of Reliability, Maintainability, and Safety assessment and costing charts. The STAGE analysis chart above, is an example of one of the standard stock charts that depict how critical failures are handled in a given system, while considering the impact of maintenance over time. The orange color bars reflect the occurrences of non-critical failures as simulated based upon a specified Maintenance philosophy and the constraints of the Integrated Systems’ diagnostic integrity.
Is the System-Level FMECA and FTA interrelated and “Integrated” with, the PHM Capability?
Traditional and rigid IVHM (or PHM) design approaches that lack the ability to equally and effectively corroborate and cross-validated design interdisciplinary assessment products (and relevant data artifacts contained therein) will continue the ongoing burdening of costs emanating from any of those sustainment maladies described above. But more importantly, will compel the IVHM design to be placed in undetermined re-work or update cycles. This is an unfortunate product from institutionalizing a specific “end-to-end” approach that discerns itself from a more forgiving, “agile” approach that is able to seamlessly “integrate” any new (or proposed) design in an assessment-corroborative interdisciplinary manner.
In traditional and rigid, end-to-end, IVHM design approaches, sustainment activities will also exacerbate a growing divergence of the IVHM’s diagnostic effectiveness as maintained systems forever change the failure characteristics within the fielded asset. Unless the IVHM’s diagnostic design can absorb these failure disparities in a seamless and scalable manner, any ongoing attempts to sustain the initial IVHM design cannot avoid the causing of the same lessons to be relearned, recycled and reworked repetitively at undeterminable costs.
Furthermore, since the IVHM design knowledge is captured within the eXpress System(s) model, the ability to effectively resume or update the IVHM will be greatly eased while costs and risks of reliance on seeking vacated or displaced expertise is marginalized.
Failures Detected (FD) and Failures Uniquely Isolated (FUI) in the eXpress FTA
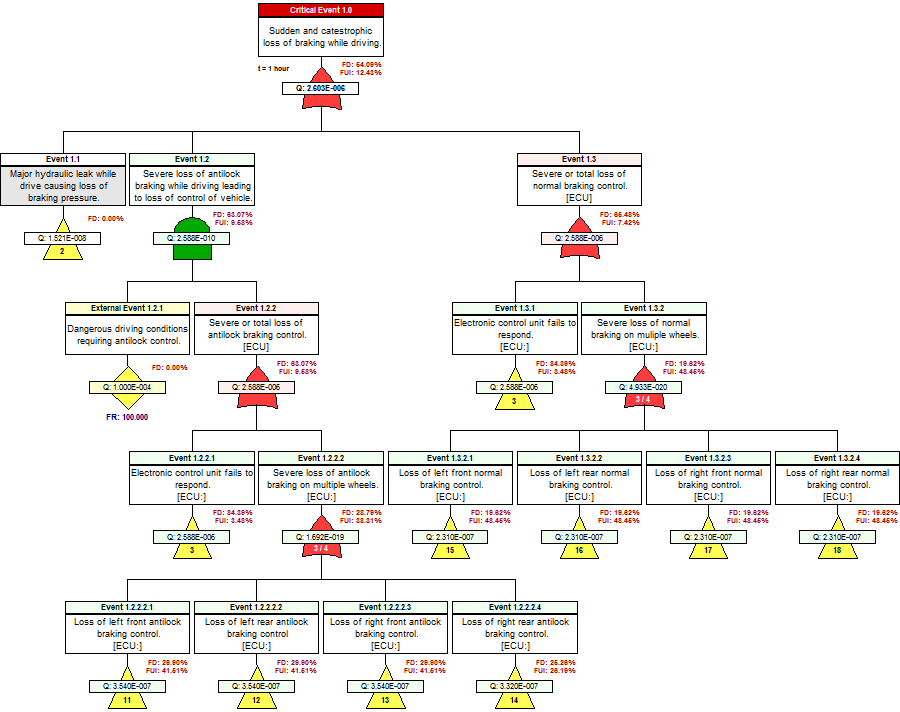
The next precursor to determining the “diagnostic utility” of the IVHM, is to assess to capture the diagnostic design within the eXpress FTA. This is an inherent capability of the eXpress FTA. As such, the eXpress FTA attaches the diagnostic detail to, and within, each branch of the FTA. This enables the discovery of the percentage of the Failures that could lead to any particular Critical (Undesired) Event that are able to be detected (FD) by our on-board IVHM.
Additionally, the eXpress FTA will enable the discovery of the percentage of the Failures that are able to be “Uniquely Isolated” (FUI) within that branch (cut set) of the FTA. The FUI also considers the exposure period (time = “t”), when any failure(s) can lead to any particular Critical (Undesired) Event. The image below highlights the “FD” and “FUI” within the eXpress FTA that can be optionally disclosed or hidden.
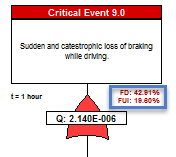
The FD and FUI can be discovered at any point in the failure propagation as can be seen below, which enables the discovery of the diagnostic integrity of the lower level designs as contained within the Integrated Systems structure.
The impact of Prognostics at the Integrated Systems’ level is immediately characterized throughout the eXpress FTA, which is a unique benefit of DSI’s highly advanced ISDD process. When a primary failure can be partially prevented using prognostics, the effective failure rate (failures despite prognostics) is displayed in magenta.
Typical Reports Generated from the eXpress FTA
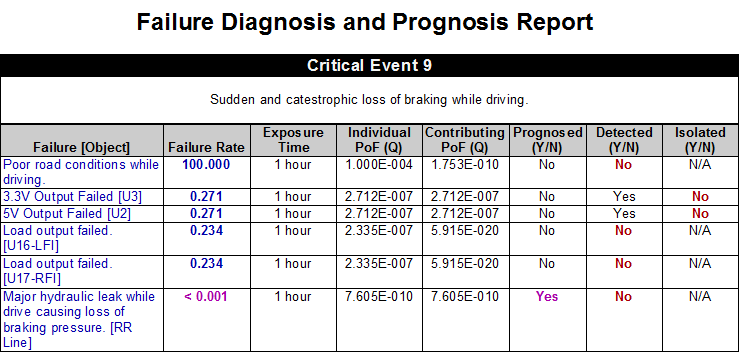
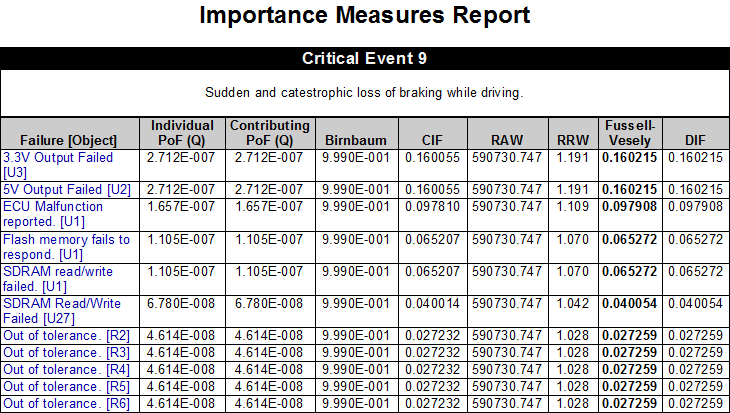
A few of the Risk Assessment Products are outputs from the eXpress FTA and are depicted below, which offer more customary data detail. One of the value and quality discriminators with these reports generated by the eXpress FTA, is that all of the data is directly tied to any on-board IVHM/PHM through the partner eXpress Diagnostic Model(s)!
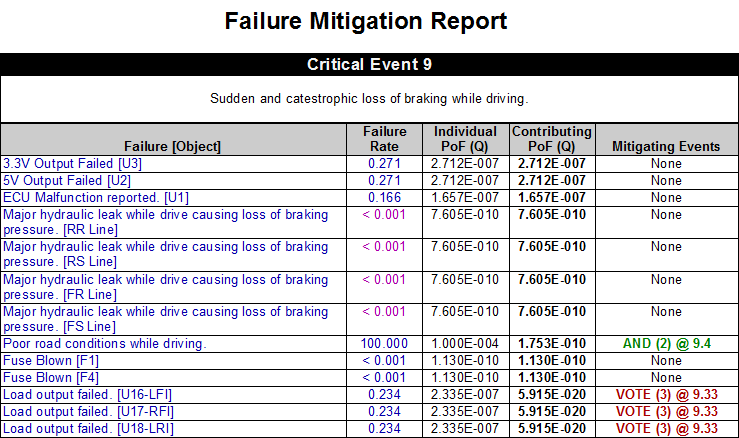
The Failure Mitigation Report shows, for each primary failure, the extent to which that failure is mitigated by functional redundancy (or some other design consideration) to prevent it from acting as a single point of failure.
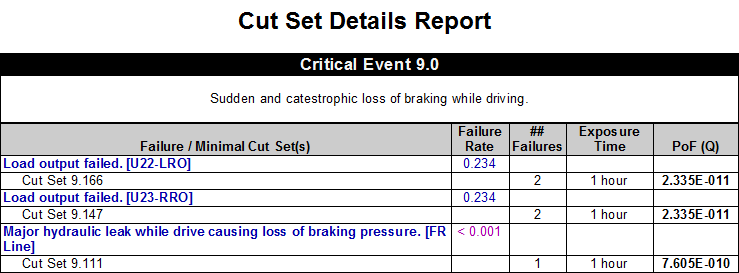
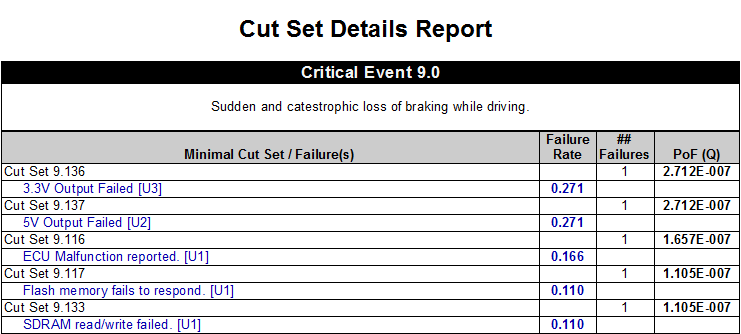
The Cut Set Details Report from the eXpress FTA Module, provides detailed information about each of the minimal cut sets for a given Fault Tree. The report can be generated as a list of cut sets (shown at left) or as a list showing the different cut sets associated with each primary failure. With user-selectable columns, sorting, grouping and filters, this report is likely to be essential to all FTA efforts.
Extensive Data Analytics projecting the impact of PHM-Constrained Maintenance
Using an operational Health Management and Support Simulation (referred to as, “STAGE”, which provides simulation-based data charts for the analysis of system diagnostics and support), the overall PHM solution can be assessed and optimized through the comparison of different maintenance cocktails.
STAGE provides a platform upon which to evaluate the various trade-offs between the development of expensive (and often unproven) prognostic sensors, the use of ineffective (“tight”) or wasteful (“loose”) maintenance schedules, and the addition of space or weight-consuming hardware redundancy. Moreover, because we’ll be (re)using an output from the data developed in our diagnostic design environment, the Data Analytics can be produced, analyzed and tweaked long before project resources have been allocated to endeavors that may not result in the desired system benefits.
The STAGE Health Management & Operational Support simulation is able to simulate the occurrence of failures of components (and based upon their respective diagnostic design impact) in accordance with their assigned failure rates over a selected sustainment horizon (“lifetime”). In this manner, the designs’ inherent diagnostic (e.g. IVHM/PHM BIT effectiveness, etc.) architecture becomes exposed.
Maintenance Philosophy
Any complex asset will typically be delivered or deployed with a specified a Maintenance Plan or warrantee as based upon the performance of the required Maintenance Plan. This can be generally referred to as a Maintenance Plan. But the question is, how should we assess the effectiveness of our Maintenance Plan. Here is where we must perform analyses that are able to compare various Maintenance philosophies, such as “Predictive Maintenance” versus “Corrective Maintenance”, and any mixtures of philosophies in an easy and understandable form using data analytics.
Extensive Data Analytics
During the development life-cycle and/or as the (evolving large scale, complex) fielded design(s) is updated for Diagnostic Assessment/Implementation (re)purposes, the agile “Captured Expert Diagnostic Knowledgebase” is exported to the STAGE Simulation environment. As such, many of the diagnostic-interrelated metrics are able to be viewed, “over time”, in a stochastic presentation for data analyses targeting the balancing of the most effective “sustainment mix”, as constrained by the diagnostic integrity of the fielded design(s).
Using STAGE (which provides simulation-based data charts for the analysis of system diagnostics and support), the overall IVHM/PHM solution can be assessed and optimized through the comparison of different maintenance cocktails. STAGE provides a platform upon which to evaluate the various trade-offs between the development of expensive (and often unproven) prognostic sensors, the use of ineffective (“tight”) or wasteful (“loose”) maintenance schedules, and the addition of space or weight-consuming hardware redundancy. Moreover, because STAGE directly utilizes data developed in eXpress, the analytics can be produced, analyzed and acted upon long before project resources have been allocated to endeavors that may not result in the desired system benefits.
When the diagnostic design is augmented with any selection of sustainment “mixtures” of preventative and corrective maintenance, STAGE will consider these parameters when producing the selected simulation graphs. These graph(s) produced from the STAGE simulation show the strengths and weaknesses of the integrated systems’ diagnostic design in a broad range of critical assessment graphs along with any selected interrelated costing or performance-related graphs.
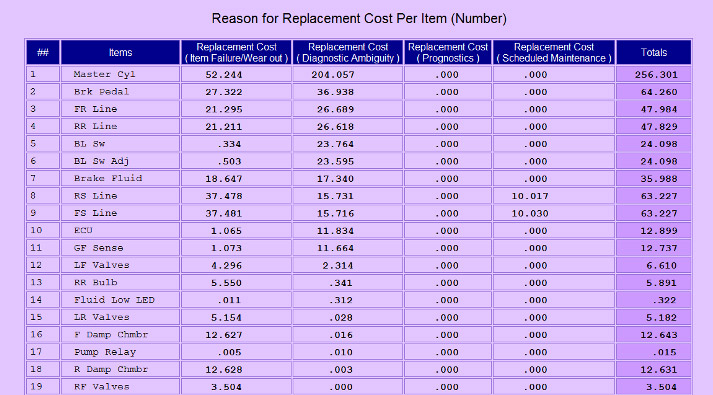
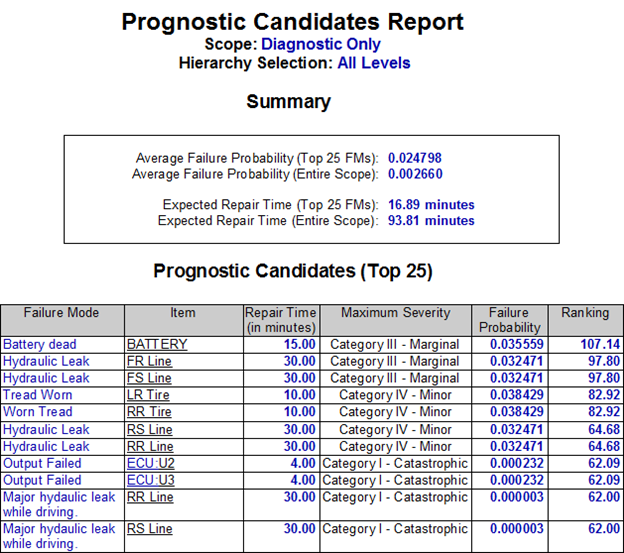
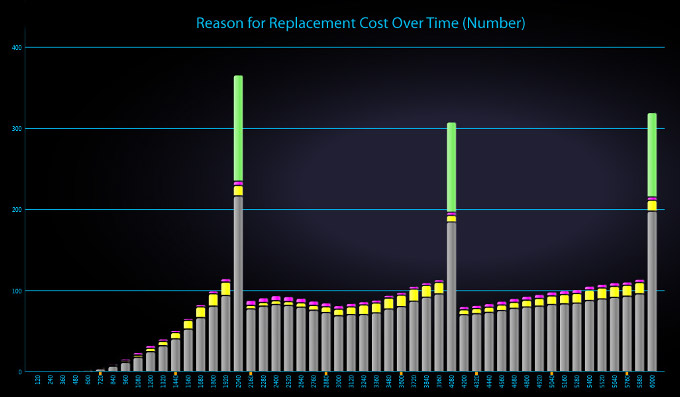
Above, the report from the eXpress Prognostics Module lists the cumulative replacement cost for each item, categorized by the reason that the cost was incurred (in this example, the items have been sorted to show those for which the greatest cost was due to diagnostic ambiguity).
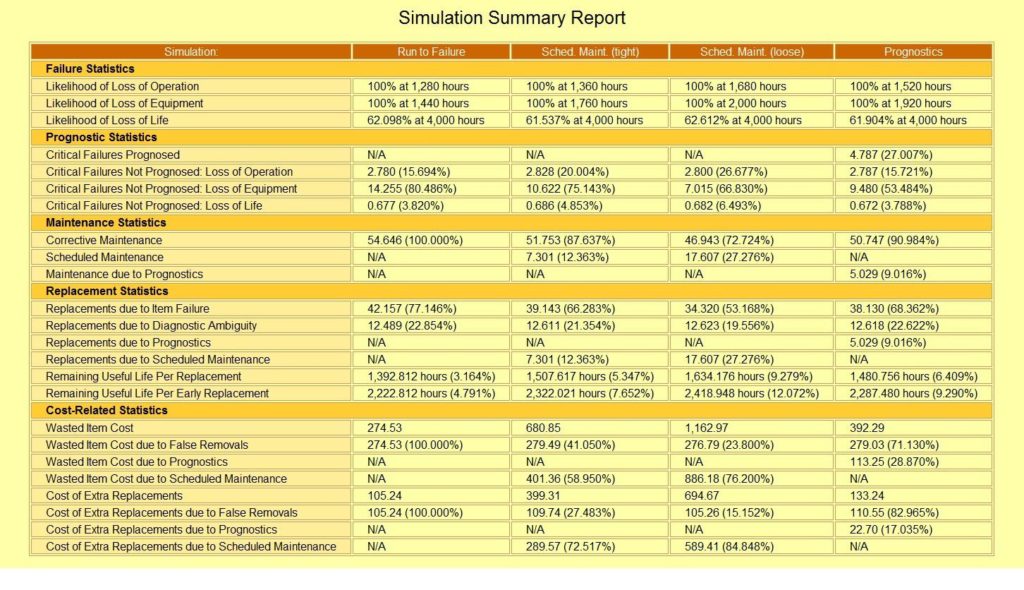
This Simulation Summary Report from STAGE lists the results from four separate simulation runs—each of which employs a different approach to maintaining the system. Although this specific example might be used to compare the relative merits of the different approaches, STAGE also allows you to simulate and compare the impact of more “balanced” maintenance plans (where each case utilizes multiple approaches to maintain the system).
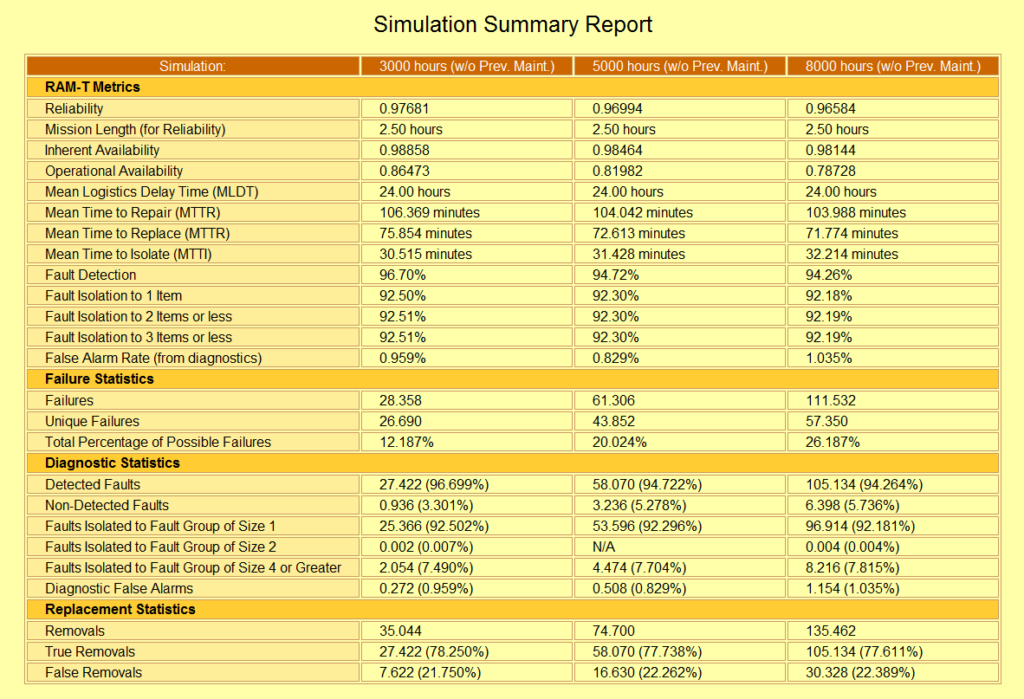
This Simulation Summary Report from STAGE lists the results of your PHM or any Maintenance Plan, as it corresponds to any desired sustainment “lifetime” to simulate and compare the impact on any particular areas of interest. STAGE is “algorithm rich”, enabling the trade-off analyses to exploit strong and weak areas of any complex design.
In STAGE, trade studies can be performed by simply saving the results of multiple simulation runs (each representing a different case under consideration). The Simulation Summary Report will automatically list the appropriate metrics side-by-side for easy comparison. Because these metrics are based on the specific calculations that you have selected for each run of the simulation, the resulting summary will include precisely those aspects of the overall health management design that are valuable within that trade study.
Simulated Analysis of Sustainment Lifecycle
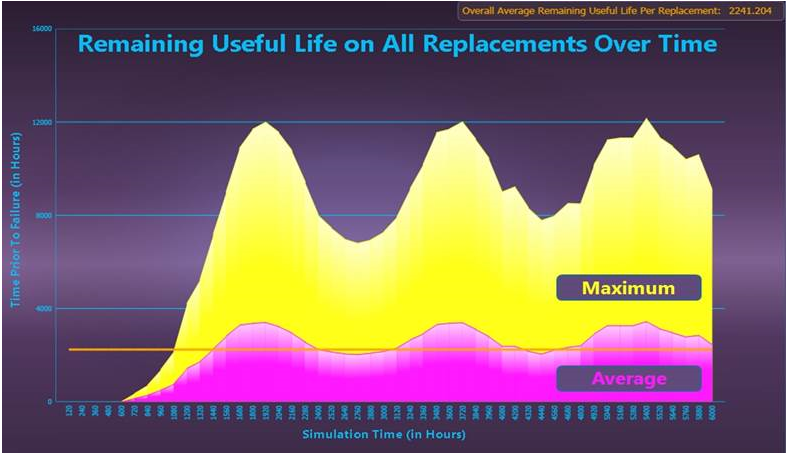
STAGE provides over 300 different graphs (alternatively viewable as reports)—many of which have been specifically designed for use in maintenance trade studies. Among the system characteristics examined are fault detection & isolation, false removals, mean time to repair, mean time between unscheduled maintenance, false alarms, false system aborts, system availability, likelihood of critical failure, critical failures prognosed, faults that occur despite prognostics, remaining useful life on replaced items, extra lost associated with premature replacement, costs associated with each maintenance category and overall costs (both non-recurring and recurring) of the maintenance solution.
Given the opportunity to perform advanced Data Analytics during the planning phases of a project, decision-makers can ensure that limited engineering resources are allocated to activities that will have the greatest positive impact upon system performance, readiness and sustainment.
STAGE calculates a wide array of typical as well as industry-new sustainment-related metrics – including the associated cost-based metrics, where applicable. Such cost-based metrics are determined by the selection of maintenance objectives and the pulling of the “attribute-rich” data directly from the (re)use of the existing Diagnostic Design Knowledgebase.
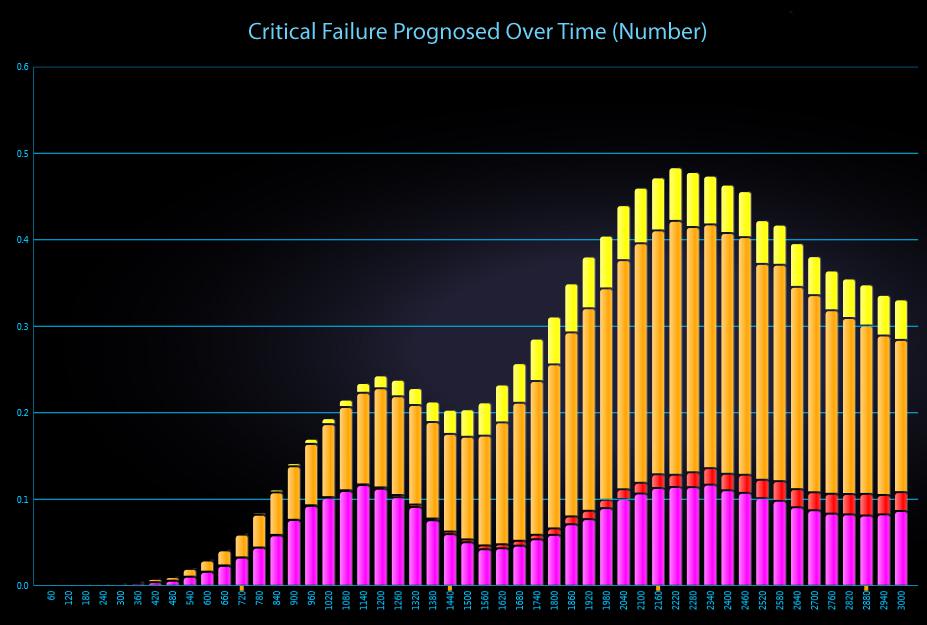
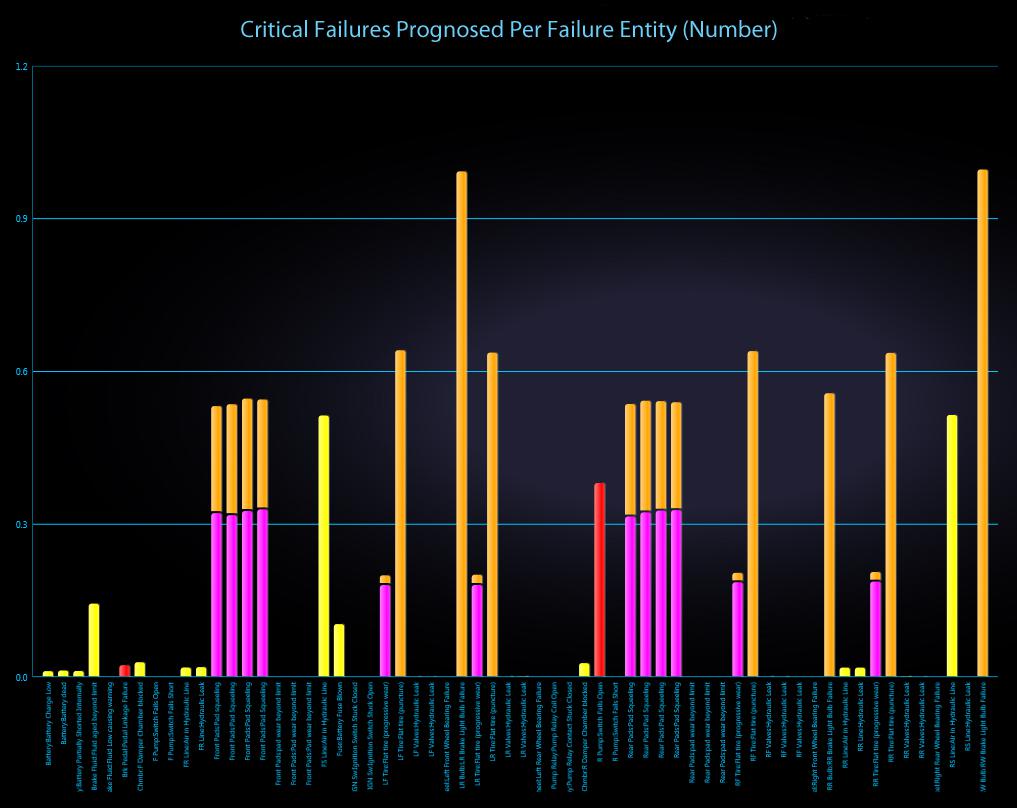
The STAGE analysis charts above depicts how critical failures are handled in a given system. Prognosed critical failures are colored magenta, whereas unprognosed critical failures are color-coded by severity (the most severe failures, for instance, are colored red). The first chart shows critical failures over time and the chart immediately above breaks down critical failures by failure mode.
Data Analytics – Presentation Ready
Every calculation in STAGE can be viewed either as a chart or as a report. You may wish to use the charts to track trends over time and the reports to investigate the causes behind those trends.
Presentation-Ready – Any of the charts produced by STAGE can be easily exported to a graphic file that can be directly incorporated into your own reports and presentations. There’s nothing quite like a graph to explain complex prognostic behavior over time.
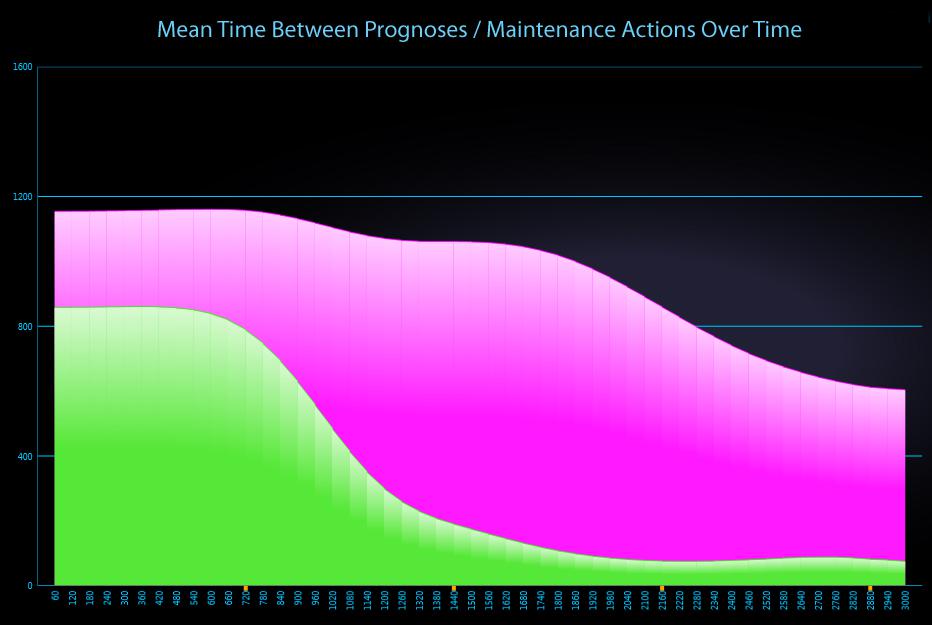
The chart above depicts the Mean Time Between Maintenance Actions due to Prognoses.
Related Links:
eXpress FTA Module
Prognostics in eXpress
STAGE Operational Support Simulation
Predictive Maintenance
FMECA Assessments
Fault Tree Analysis
Synchronizing Diagnostics and FUI
