


Products
Probability of Failure Report
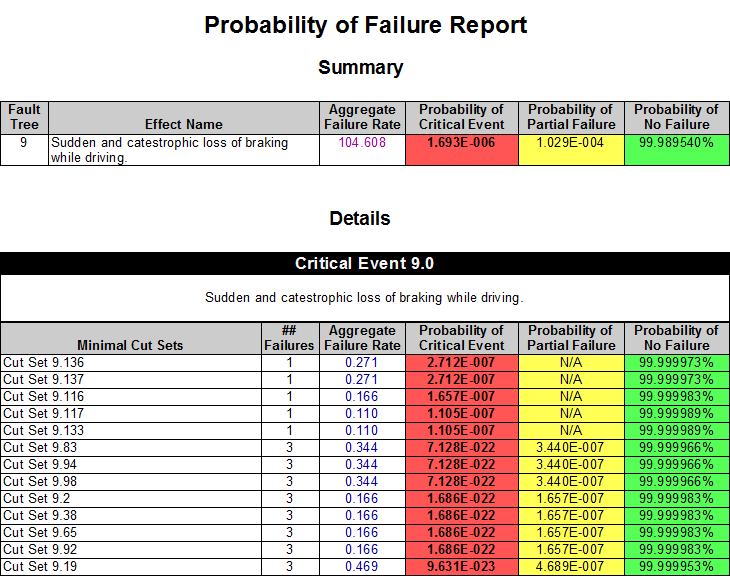
The Probability of Failure Report lists the likelihoods of critical failure, “partial” failure (Fail Safe) or no failure in columns colored red, yellow & green. Probabilities are calculated for minimal cut sets or for individual failures, showing how they collectively result in the critical event’s overall probability of failure. An optional summary lists the overall probabilities for each fault tree in a single table.
Metric Descriptions
Aggregate Failure Rate
In the summary section, the Aggregate Failure Rate is the sum of the failure rates (adjusted to account for prognostics) for all primary failures that contribute to a particular critical failure.
In the details section, the Aggregate Failure Rate is the sum of the failure rates (adjusted to account for prognostics) for all primary failures that comprise a particular minimal cut set.
If the aggregate failure rate has been adjusted to account for prognostics, it is displayed using magenta text; otherwise, it is displayed using blue text.
Probability of Critical Event
In the summary section, the Probability of Critical Event is the overall likelihood that a particular critical failure will occur.
In the details section, the Probability of Critical Event is the likelihood that a critical failure will occur due to the primary failure(s) in a particular minimal cut set.
Probability of Partial Failure
In the summary section, the Probability of Partial Failure is the overall likelihood that a primary failure occurs that, were it to have failed in combination with other failures, would have caused a particular critical failure to occur.
In the details section, the Probability of Partial Failure is the likelihood that a primary failure in a particular minimal cut set will occur, yet will not result in the associated critical failure.
Probability of No Failure
In the summary section, the Probability of No Failure is the overall likelihood (represented as a percentage) that no failures occur which, alone or in combination with other failures, could cause a particular critical failure to occur.
In the details section, the Probability of No Failure is the likelihood (represented as a percentage) that no failures occur in a particular minimal cut set.
