


Products
Failure Diagnosis and Prognosis Report
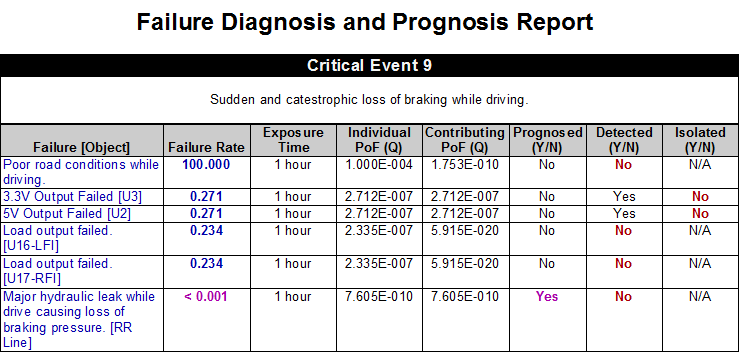
The Failure Diagnosis and Prognosis Report shows, for each primary failure whether the failure is detected, prognosed and uniquely isolated to a single failure. This is useful in determining the likelihood of a critical event is impacted by detection and prognosis and how isolation effects system availability when a critical fault is isolated with a non-critical fault.
Metric Descriptions
Failure Rate
The Failure Rate for a particular primary failure is the expected number of failures (per million hours), reduced by the percentage of those failures that are expected to be averted through the use of prognostics.
If the aggregate failure rate has been adjusted to account for prognostics, it is displayed using magenta text; otherwise, it is displayed using blue text.
Exposure Time
The Exposure Time is the time interval used for the Individual Probability of Failure calculations.
Individual PoF (Q) – Individual Probability of Failure
The Individual Probability of Failure represents the likelihood that a particular element will fail within the specified exposure time.
Contributing PoF (Q) – Contributing Probability of Failure
The Contributing Probability of Failure is the portion of a particular element’s Individual Probability of Failure that is included in the overall probability of critical failure.
Prognosed (Y/N)
Prognosed (Y/N) is set to “Yes” when a particular primary failure can be prognosed (with any degree of confidence).
Detected (Y/N)
Detected (Y/N) is set to “Yes” when a particular primary failure can be detected.
Isolated (Y/N)
The Isolated (Y/N) is set to “Yes” when a particular primary failure can be uniquely isolated.
