


Products
Customized Automation
The fault tree in eXpress has a fully customizable set of options to design how the fault tree appears in standard configurations.
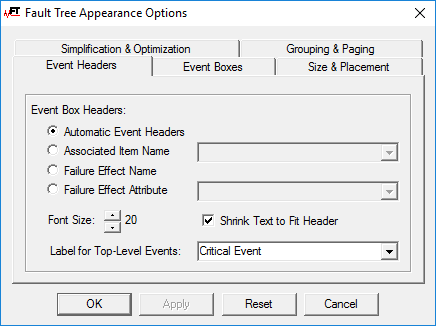
Fault Tree Appearance Options
The “Fault Tree Appearance Options” dialog allows the user to fully customize the fault tree event appearance setup different looks for the fault tree which include:
1. Control details, appearance, sizing and placement of the event in the fault tree.
2. Specify automatic simplification details by removing or retaining repeated events, logically redundant events and fully-prognosed failures.
3. Specify the level of automatic optimization when the tree is display in the optimized mode.
4. Specify automatic grouping and paging details to simplify the display of the tree to improve readability.
Fault Tree Appearance Options Dialog
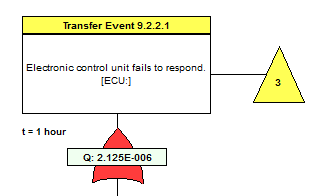
Multipage Mode and Transfer Events
When displayed in multipage mode. Transfer events simplify the diagram by placing common or complex event structures on separate pages of the FTA with a Yellow triangle pointing to the page number of the transferred events.
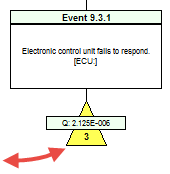
Fault Insertion and Event Status
Faults may be inserted into the FTA by selecting the root failures and changing the status from “Unknown” to either “Failed” or “Not Failed”. When the event status has been changed then all of the dependent events of the selected root failure will be highlighted in red or green depending on whether “Failed” or “Not Failed” was selected. The likelihood of the dependent events will then be recalculated based upon the assumption that the given root failure is proven “Not Failed” or indicted as “Failed”.
Three Different Views to Display the FTA
One of the unique features of the eXpress FTA is that it provides three different ways of viewing a given fault tree: “As Modeled”, “Simplified” and “Optimized”.
- As Model FTA – The as modeled FTA shows the events exactly as defined in the model without any kind of simplification or optimization.
- Simplified FTA – The simplified mode removes unnecessary events based upon the user defined setting for degree of simplification.
- Optimized FTA – The optimized mode both simplifies and reorganizes the logic of the tree to account for multiple occurrences of the same event (so that displayed failure probabilities are equivalent to those calculated from the Minimal Cut Sets).
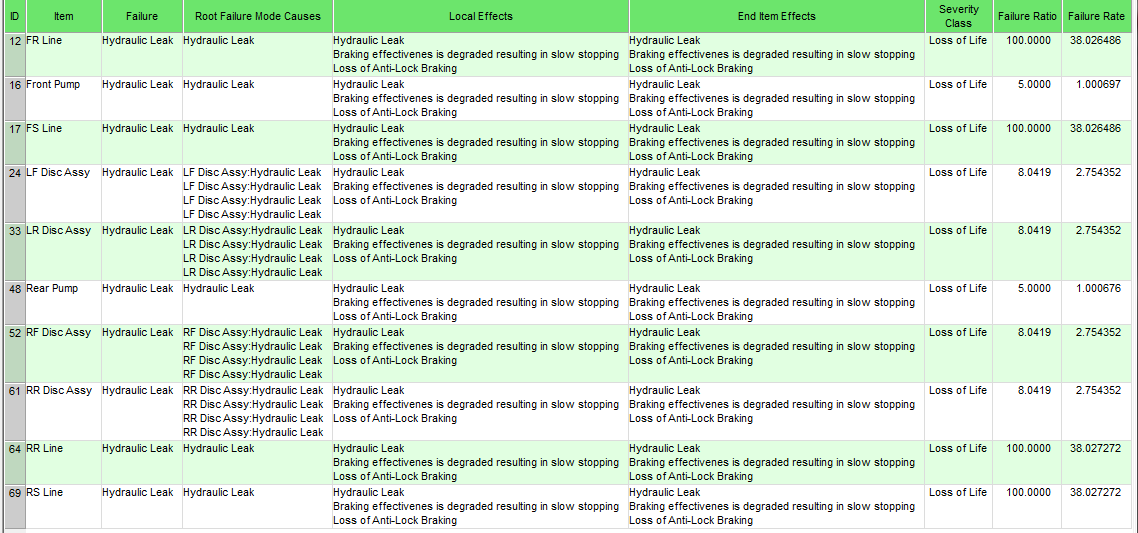
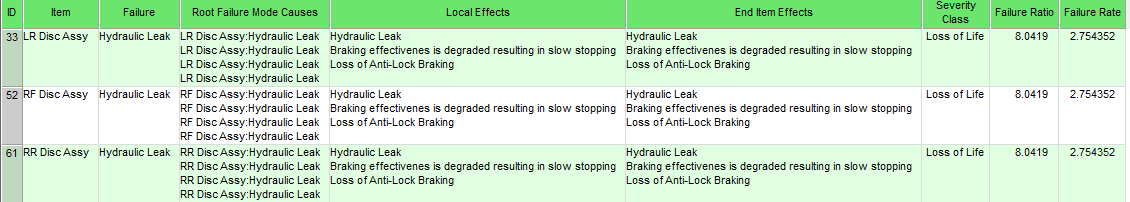
Display FMECA Chart
In eXpress, fault trees are displayed using the same graphic interface that is used to display eXpress FMECA charts. One benefit of this tight integration is that each fault tree also serves as an index to information in the corresponding FMECA. This is particularly powerful when your FMECA has custom columns containing project-specific data. Many companies treat their FMECAs as data repositories for multiple design and analysis disciplines. With the eXpress FTA module, this information remains at your fingertips as you evaluate the system-level impact of failures using fault trees.
Display FMECA Chart using Fault Tree Events
During fault tree editing, FMECA rows that are related to the selected fault tree can be optionally displayed (instead of the fault tree diagram) on the right-hand side of the screen. When one or more entries are selected in the Explorer Tree on the left – which the fault tree events, then the chart will be further filtered to list only FMECA rows related to the selected entries.
Display FMECA Chart using Minimum Cut Sets
During fault tree editing, FMECA rows that are related to the selected fault tree can be optionally displayed (instead of the fault tree diagram) on the right-hand side of the screen. When one or more entries are selected in the Explorer Tree on the left – which contains the Minimal Cut Sets, then the chart will be further filtered to list only FMECA rows related to the selected entries.
Display Qualitative vs Quantitative
The display of the tree can be transitioned between a quantitative view which displays the likelihood of occurrence of the critical event and the qualitative tree which displays only the relationships between dependent events.
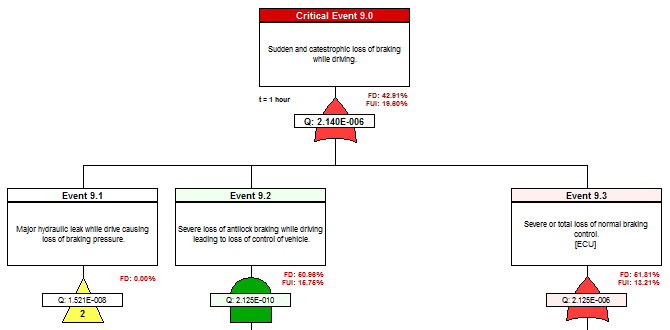
Fault Insertion showing qualitative vs quantitative views
