


Solutions
Simulation-based Assessments
Advanced Simulation-based Assessments – STAGE
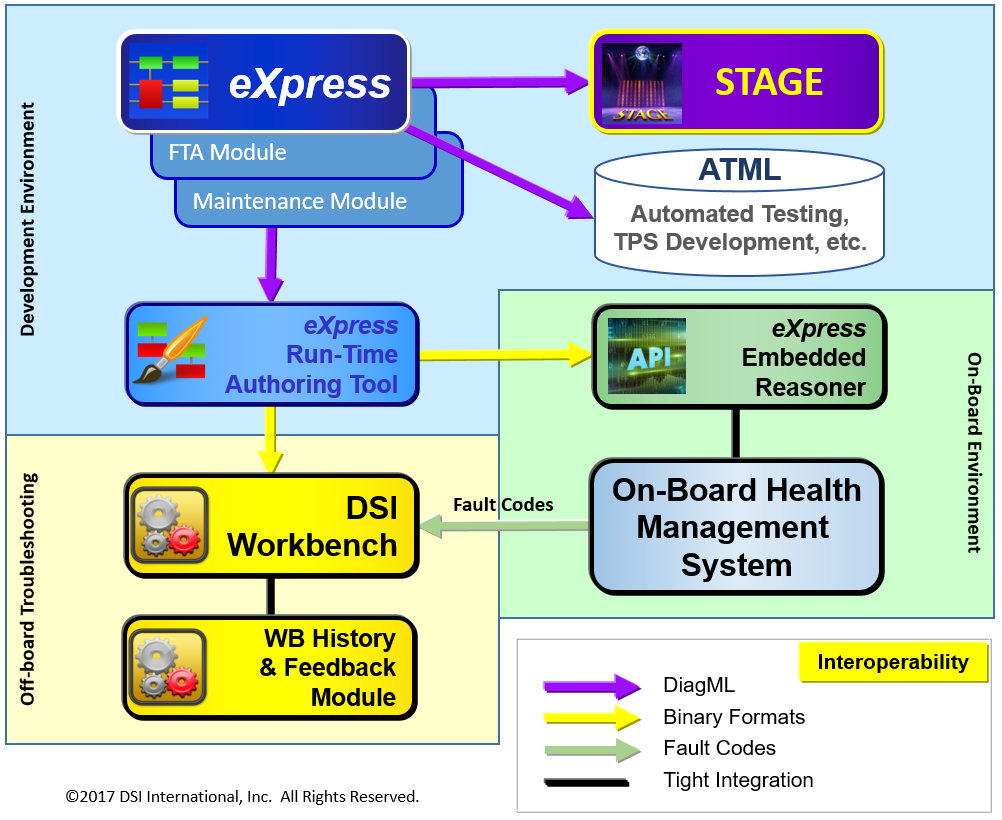
As an integrated component of Integrated System Diagnostic Design (ISDD), we can reuse our existing Integrated Systems’ (fielded product) eXpress models in the companion Operational Support Simulation tool, “STAGE”.
STAGE offers an unprecedented capability to examine the impact of the design’s diagnostic capability in terms of its strengths and weaknesses over any sustainment lifecycle(s). This will provide us with a much broader palate to discover and “trade” previously undeterminable areas of costs and value that are strictly a reflection of the design’s diagnostic constraints during its operational lifetime.
Traditional approaches used metrics based on the delivery of assessment products used to describe discrete values to determine requirements conformance and product delivery acceptance. This was a common approach used to characterize the design’s ability to meet certain specified Reliability, Safety, Maintainability and Testability Requirements as a condition of product acceptance. But questions regarding the Elephant it in the room are, when does the delivered product actually meet such sustainment-relevant requirements criteria? At delivery? Twenty-nine months after deliver? Else, when? Do these values ever change whenever the design is used or as impacted by maintenance activities?
What’s more troubling, is that these assessment products are too narrowly-developed and independent of input that could otherwise be “cross-validated” and leveraged from any other interrelated design discipline to a much grander scale in a truly collaborative design development environment.
How do we really improve the utility of the assessment products – and make them affordable and simple “turnkey” outputs from a diagnostic design knowledgebase? DSI introduced simulation-based assessments as far back as 2008. But such ideals were ahead of its time and not easy to champion since traditional and antiquated assessment requirements have, until recently, been the incumbent and fallback remedy. The climate is changing today, however. Data Analytics and Simulation-based assessments are already gaining favor in more advanced applications in industry. This welcomed trend could likely evolve to be the preferred basis for supporting truly meaningful design assessments. And, fortunately, STAGE produces a boatload of both TODAY!
As an integrated component of ISDD, the design’s captured knowledgebase (comprised of integrated eXpress supporting sub-system models) can be transferred into STAGE, DSI’s Health Management and Operational Support Simulation tool. Here is where we can observe the crucial role that the design’s diagnostics capability plays in the ability for the design to be available, safe, successful and affordable, while considering the impact of maintenance on the fielded design(s).
Be prepared for a bit of shock. Designs that appear to excel in achieving good marks within the inherent shallowness of traditional design assessments products, may suddenly produce very disturbing performances in several key sustainment areas. Operational Availability and affordability, are the very first areas that are victims of poor diagnostic acumen – regardless how beautiful and impressive the results described in the Reliability and Maintainability design assessment products.
Enriched PLM – NO need to establish a Separate Database!
The STAGE Simulation enhances Design Influence & provides a vast new trade space for decision-making purposes targeting assessments for new or alternative design configurations. STAGE is performed initially during the design development process by reusing your diagnostic design data captured in eXpress. Additionally, it can be used during the sustainment lifecycle to assess sustainment trending analyses for improving informed maintenance activities!
But the greatest value from STAGE will be realized during the design development as an advanced design assessment and analyses tool to optimize sustainment objectives. In this endeavor, STAGE provides an opportunity to evaluate and balance the sustainment philosophy, iteratively during design development, at key intervals during the sustainment lifecycle.
STAGE uses a catalog of many stock algorithms that you can select from a menu to produce results that provides data analytics from cost-effective alternatives resulting from trading for optimal operational success, safety, availability and affordability. It also has a facility to enable the addition of unlimited “scripts” to represent any specific sustainment parameters that may be of value to any uniquely-specific or complex design.
Unprecedented DATA ANALYTICS
Since the eXpress models contain the “DNA” of your design’s diagnostic capability (or sometimes referred to as an asset’s “Digital Twin”), the Health Management and Operational Support Simulations performed in STAGE, offer an entirely new dimension showing the dramatic impact of a design’s diagnostic acumen upon its sustainment performance!
STAGE’s unique strength is its producing of high-impact, colorful graphs of time-based assessments that immediately communicate sharp, clear, brand new and previously unavailable data. What is so unique to STAGE is that its simulations reflect the true, and often hidden characteristics, codifying the diagnostic integrity of the design. Once the diagnostic design is fully delimited within STAGE, you simply select or describe any maintenance philosophy to be matched to support or sustain the design. You will then witness the tremendous impact of a diagnostically-effective design versus a diagnostically-compromised design. The resulting graphical outputs vividly underscore the dramatic disparities and with virtually no additional work whatsoever!
Diagnostic Effectiveness as Related to Test Coverage Constraints
To evaluate the design of a FULL INTEGRATED SYSTEM – NOT just a single component or any single subsystem. Design decisions are to be based upon fully describing “Test Coverage” at every level of design & for any & all type(s) of “test(s)” (e.g. SBIT, CBIT, PBIT, inspection, sensors, etc.) and any mix therewith in aggregate for the integrated system design. All test coverage will be validated with appropriate SME to ensure the quality of test data (diagnostic conclusions from “pass” or “fail” test results) capture and accuracy for each piece of the design, but limited to one-level below the replaceable unit.
Diagnostic Effectiveness as Related to Maintenance Constraints
Our context will include the capture of the LORA and any corrective actions or time-related SWAGS (as current as possible and can be iteratively updated & fined-tuned as design matures) from Maintenance Engineering. We will also include the capture of any available Reliability data (FE, FR, etc.) as available, used or produced from any other RE preferred tool, source or method as it becomes available. We will (re)use any independently-owned disciplinary data investment (on an iterative basis) for inclusion into our design data capture environment, eXpress.
Preparing to Organize and Structure the Captured Data into a Knowledgebase
The data capture tool, eXpress will organize & structure all design data elements or assessment products as available for the purpose of establishing exhaustive design functional and failure interdependencies. When all design interdependencies are described and integrated with and among any other companion designs’, we are able to form a “knowledgebase”. When the “Test Coverage” for any “tests” (including sensors, BIT and any other testing applications), we now have the framework for forming a “Diagnostic Digital Thread”.
Additionally, the knowledgebase will include a myriad of design-relevant attributes and generate the new organized structure of interdependencies within the design. We can then determine the effectiveness of our diagnostic (including any POF sensing) interrogation capability of our integrated system. In this process, we are able to generate a myriad of assessment metrics for any “slice & diced” subset(s) design(s) contained within our system(s) to enable a method to the discovering the test coverage effectiveness at the system level, and for any specific operational state(s).
Generating and Reusing the Designs’ Knowledgebase
Once the design has been processed in eXpress, we will use the “cooked” knowledgebase from eXpress that now contains the combined and integrated design data from each design independent discipline. We will then use this identical knowledgebase through an export facility in eXpress that produces a “free” public XML format, “DiagML”, which can imported into many other third party test tools, DSI Workbench, or STAGE, DSI’s Operational Support & Health Management Simulation Tool.
We need to use the exact same data from which we have already produced static, single-point assessments that satisfy CDRL’s as specified by DoD customer requirements, to produce a whole new set of “Simulated” metrics that describe the effects of any of our design decisions over any time interval (“life time”) – but with the consideration of maintenance. For the purposes of our simulation, Maintenance will be in accordance with the LORA as specified by Maintenance Engineering and in accordance with the predictive or corrective maintenance philosophy, but constrained by the effectiveness of our sensors (test coverage) per operational state of our system.
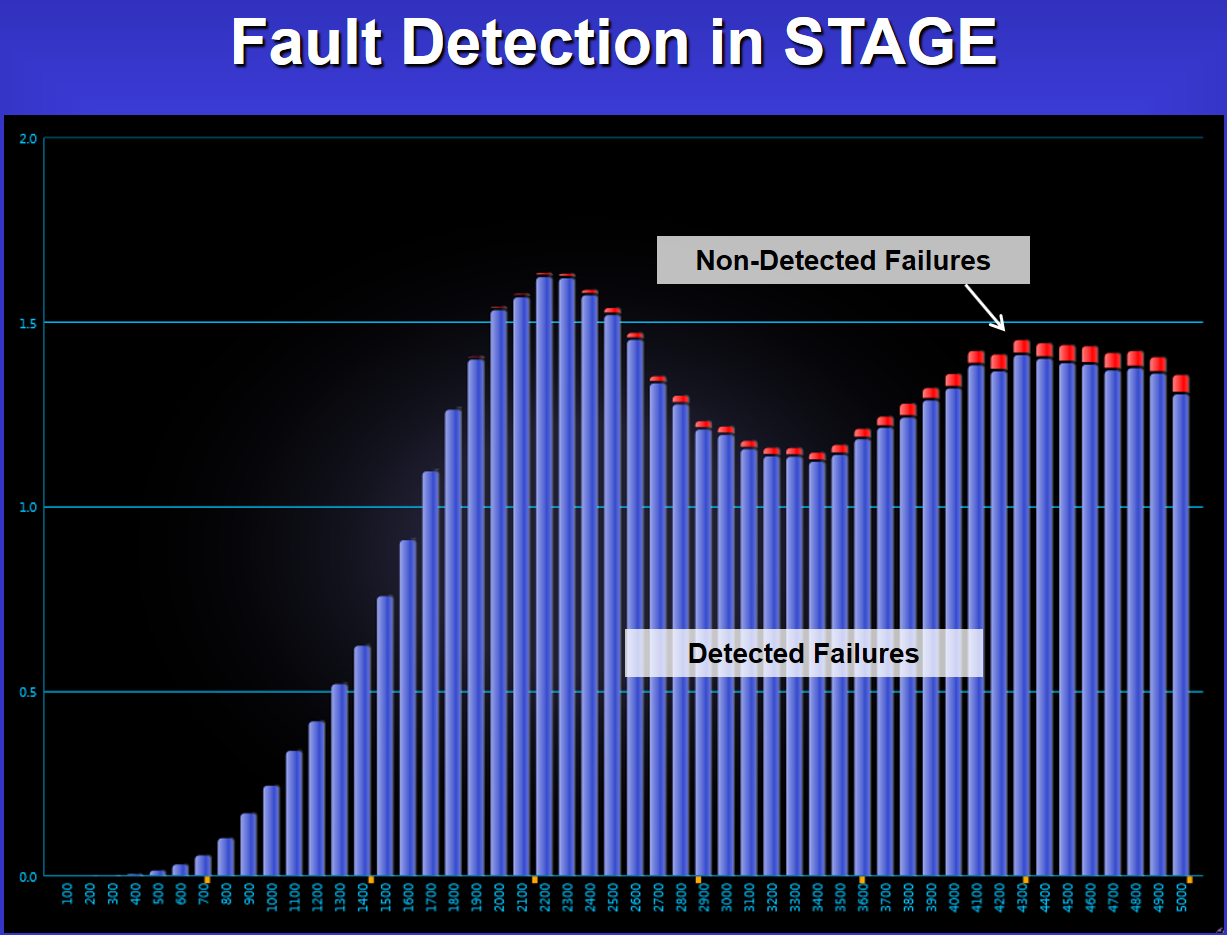
STAGE provides a large list of “stock calculations”(shown near the bottom of this page) which can be used to evaluated and trade-off various aspects of the design, support and sustainment phases of the life cycle. The above chart shows the relationship of detected failure vs non-detected failures for a particular design.
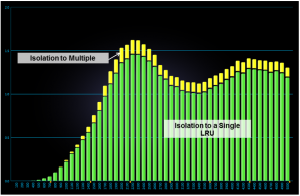
Fault isolation to a small ambiguity group (preferably a single LRU) for the majority of the faults detected is an important factor in diagnostic design and implementation. The STAGE chart above shows how one example design measure up in a graphical perspective.
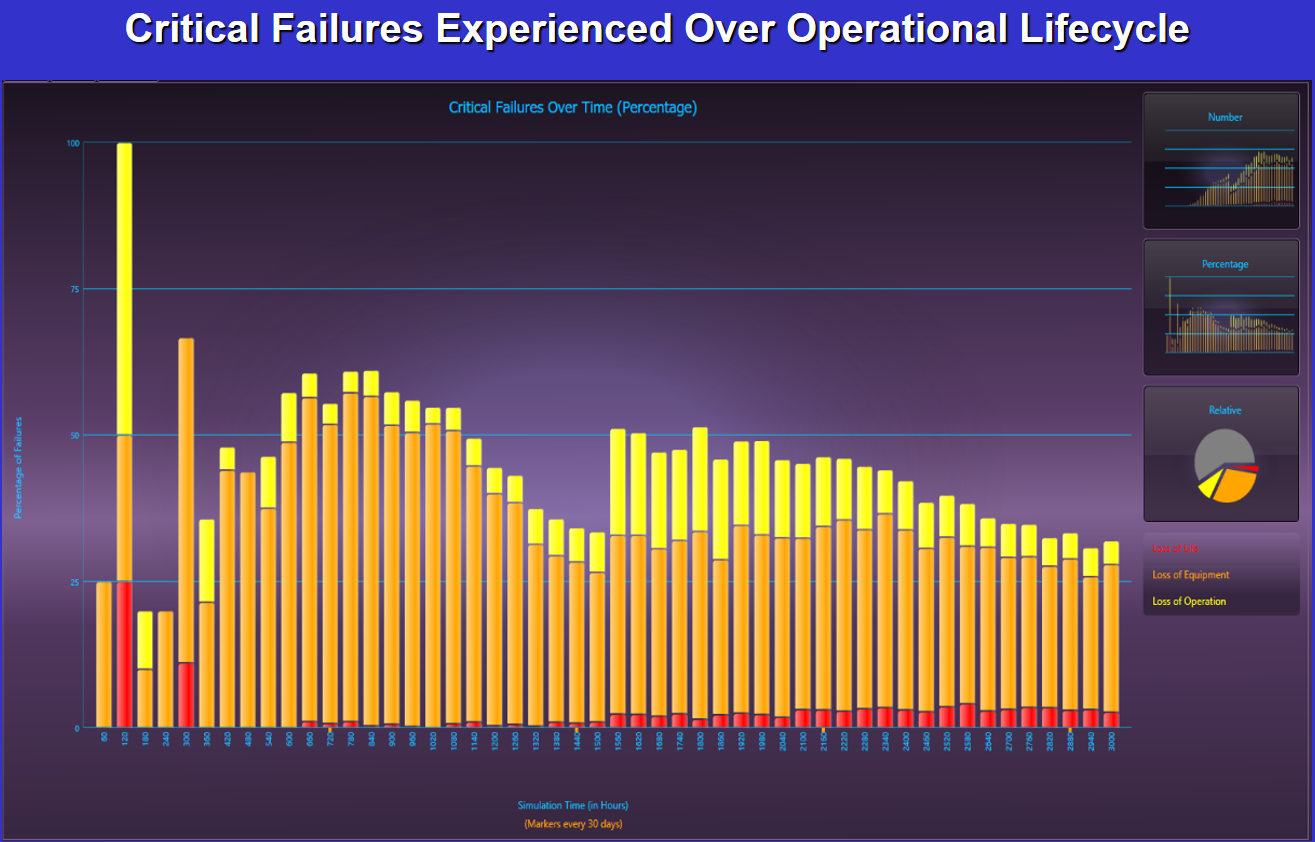
The “Critical Failures Experienced Over Operational Lifecycle” graph above, is useful to help identify areas of the design where diagnostic emphasis should be focused.
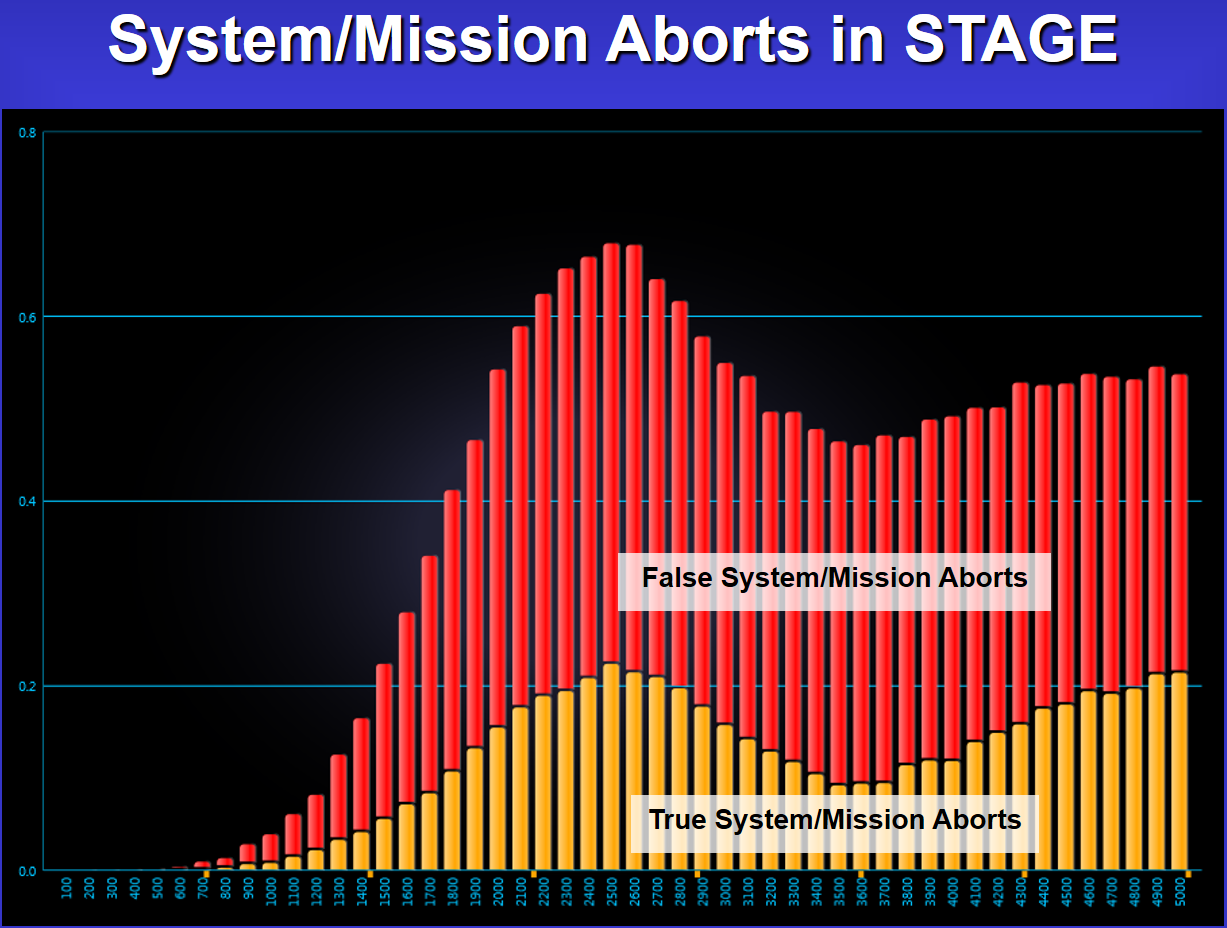
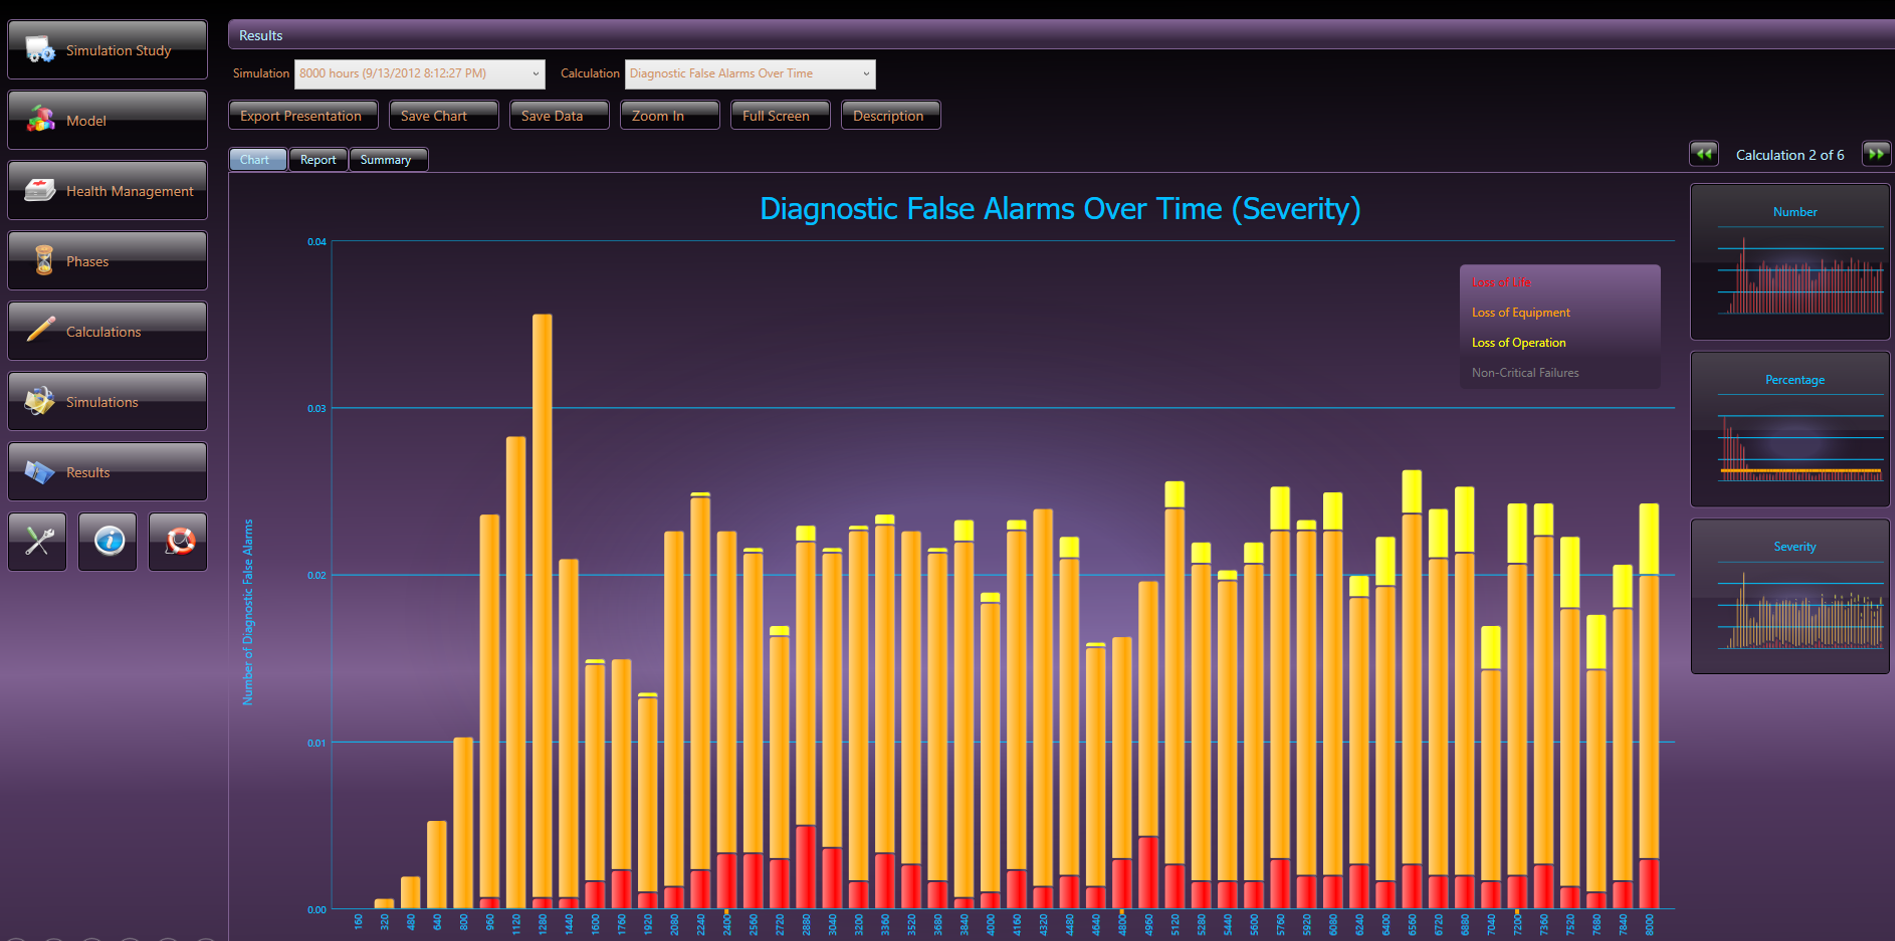
“System or Mission Aborts” (above), whether real or false must be a diagnostic priority especially where safety is a concern. “Diagnostic False Alarms” (below) is another valuable output from a Diagnostic Assessment.
STAGE Simulations with Traditional Diagnostic Data Analytics
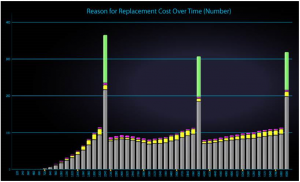
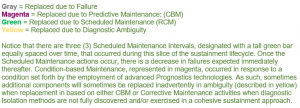
We may remove multiple components (some failed, some non-failed) in any maintenance activity as determined by our Maintenance Schedule, our Prognostic effectiveness (and any related scope, horizon, accuracy & confidence based upon POF studies) our opportunistic replacement strategy (replacing for convenience as hoping to increase availability or defer cost of repeated costs of additional components with a lower RUL), or any Corrective Maintenance based upon the limitations of our Fault Detection and Fault Isolation capability. These Maintenance Actions will all have an impact upon replacement time(s), cost(s), number of components and accuracy or effectiveness of diagnosis/prognosis.
STAGE Simulations Balancing Prognostics with Traditional Diagnostic Data Analytics
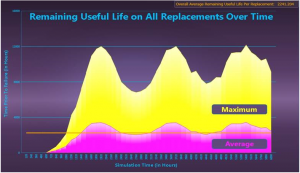
“STAGE” can show the impact of any sort of maintenance philosophy or “mix” of maintenance approaches, including “Condition-Based Maintenance” or “CBM”, which is frequently considered with the incorporation of “Prognostics” in the operational and maintenance environment. Variables are first related to prognostic requirements, such as Horizon (Remaining Useful Life), and confidence / accuracy level. Running the resulting diagnostics with these prognostic tests can then be run in STAGE simulation to show the impact on maintenance actions and down time over time.
Vary Maintenance Paradigms
With the Operational Simulation from same design knowledgebase that we initially produced the static metrics, we will now be able to determine which of the following time-based metrics will provide useful information for making, not just design decisions, but also “Maintenance” approach decisions. Since we will likely be very surprised how our design reacts or differs in a simulated assessment than from a traditional metric producing paradigm. Where we may have produced ideal static independent discipline-based metric results, we may now produce very surprising or even disturbing, discipline-interdependent, time-based results through a stochastic simulation process – or visa-versa, depending on maintenance, type, frequency, philosophy and the diagnostic integrity of our system.
Getting Creative with STAGE
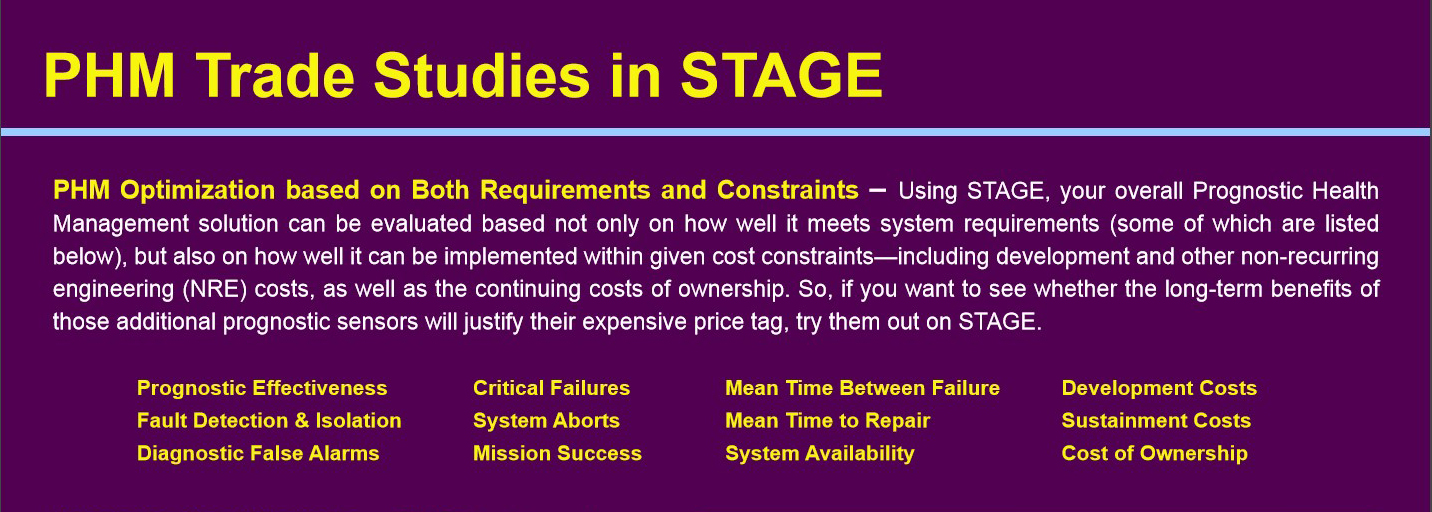
Let’s be aware that STAGE has an abundance of metrics and some may have more utility when varying the sustainment objectives. With STAGE, you’ll discover many new metrics – and look at the impact of assessing a design and maintenance strategy (that can also evolve with design updates). We will select any of the algorithms described below, which are simply “stock” calculations that produce graphs to place on PowerPoints or can simply produce values that can be placed in a grid to compare results for multiple life time(s) enabling the opportunity to observe how to find the optimum ‘BALANCE’ of maintenance approaches to optimize the impact on the four (4) main goals of Systems Testability: Operational Success, Safety, Operational Availability and Cost of Ownership.
Here is a listing of some of the “Stock Calculations” in STAGE: (Click on the pull-down menu below and scroll to view the entire listing)
There are many other considerations that can be assessed as well. But the goal is to allow the assessment to accommodate any objective or any complex program before significant investment is made by dismissing the opportunity to discover if there is merit to any of the metrics (conventional and/or progressive) to best exploit or represent the diagnostic integrity of the design. Now, the only answer that matters about the value of any metric (be it a discrete value or produced from a stochastic process) is the answer that supports the context the operational and sustainment requirements.
